22 May 2006
STI Long Term Waves Analysis (22 May 06)
Based on STI long term chart, it is possible that wave (3) have completed at 2666 since it consisted 5 up waves, very clear, very beautiful. Currently, it is possible that STI is doing wave (4), which may well be a symmetrical triangle correction formation in the form of ABCDE 5 waves, and wave A of wave (4) is still to complete, wave a of Wave A has just completed, then Wave b of Wave A will follow suit. Then wave c of Wave A will begin. Since wave a is very sharp, wave b will be small and long, wave c will be the same size as wave a or 1.618 times of wave a. My general feeling is that do not need to be too worrisome. This is not the end of the world. Many opportunities will appear during the whole correction process (wave (4)) though not big. Let's prepare to catch up with the up waves in wave (4), cheers!
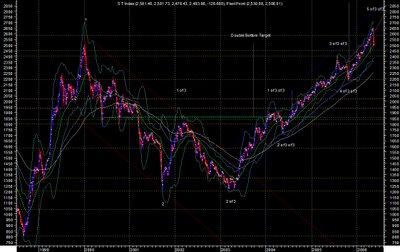
Chart from
http://thoughts-denzuko1.blogspot.com/
Labels: Elliot Wave Analysis
STI
Hourly charts indicates the possibility of a B-wave technical rebound occurring this week that could retrace 38.2% to 50% of the index''s fall from 2666, which should lift it back to the 2550 to 2572 range.

Hourly charts indicates the possibility of a B-wave technical rebound occurring this week that could retrace 38.2% to 50% of the index''s fall from 2666, which should lift it back to the 2550 to 2572 range.

Labels: Elliot Wave Analysis
20 May 2006
Nasdaq Chart - Global Market Correction may have completed! Nasdaq strong support 2200, see weekly chart, neckline of rising triangle, downside limited, worst senario drops to 2100
At least, there will be a technical rebound. Buy selectively to participate the expected technical rebound. Market may begin to consolidate in the bottom for a few days before a real rebound. Buy low, now it is low.


At least, there will be a technical rebound. Buy selectively to participate the expected technical rebound. Market may begin to consolidate in the bottom for a few days before a real rebound. Buy low, now it is low.


S&P 500 Chart - Global Market Correction may have completed!
Strong support 1245, see weekly chart. Sitting on support currently. Downside is limited.
At least, there will be a technical rebound. Buy selectively to participate the expected technical rebound. Market may begin to consolidate in the bottom for a few days before a real rebound. Buy low, now it is low.


Dow 30 Chart - Global Market Correction may have completed! Dow strong suport 11000, see weekly chart
At least, there will be a technical rebound. Buy selectively to participate the expected technical rebound. Market may begin to consolidate in the bottom for a few days before a real rebound. Buy low, now it is low.


Top Trader - Trading to Rich
At least, there will be a technical rebound. Buy selectively to participate the expected technical rebound. Market may begin to consolidate in the bottom for a few days before a real rebound. Buy low, now it is low.


Top Trader - Trading to Rich
11 May 2006


ECS
Buy 0.35-0.355, first technical tg 0.39


Buy 0.35-0.355, first technical tg 0.39


Shopping List
Can buy below counters at current level, details will be out when time allows today or tommorrow,
ECS - 0.35 0.36
Lasseters 0.26
Kian Ann 0.18-0.19
Chip Eng Seng 0.22-0.225
Contel 0.33-0.335
C & O 0.45-0.46
Ace Danamics 0.205-0.21
Landwind 0.54-0.55
Europtron 0.195-0.20
Aztech 0.255-0.26
China Essence 0.66-0.665
MIT 0.165-0.17
10 May 2006


![]()