28 February 2011
We may have seen the worst of deep correction this time
ratio of stocks with bullish candlesticks having appeared on the weekly charts as at 28 Feb 2011
My portfolio = 7/17 = 41%
Portfolio 1 = 19/50 = 38% (blue chips)
Portfolio 2 = 24/43 = 56% (second liners)
These Ratios in significant bottom in Jun 2010
My portfolio = 12/17 = 70%
Portfolio 1 = 41/50 = 82% (blue chips)
My portfolio = 7/17 = 41%
Portfolio 1 = 19/50 = 38% (blue chips)
Portfolio 2 = 24/43 = 56% (second liners)
These Ratios in significant bottom in Jun 2010
My portfolio = 12/17 = 70%
Portfolio 1 = 41/50 = 82% (blue chips)
Labels: Thoughts
25 February 2011
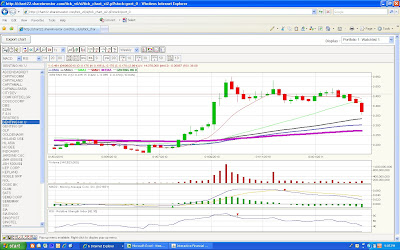
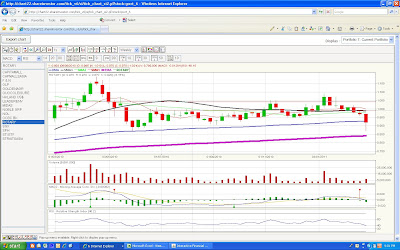
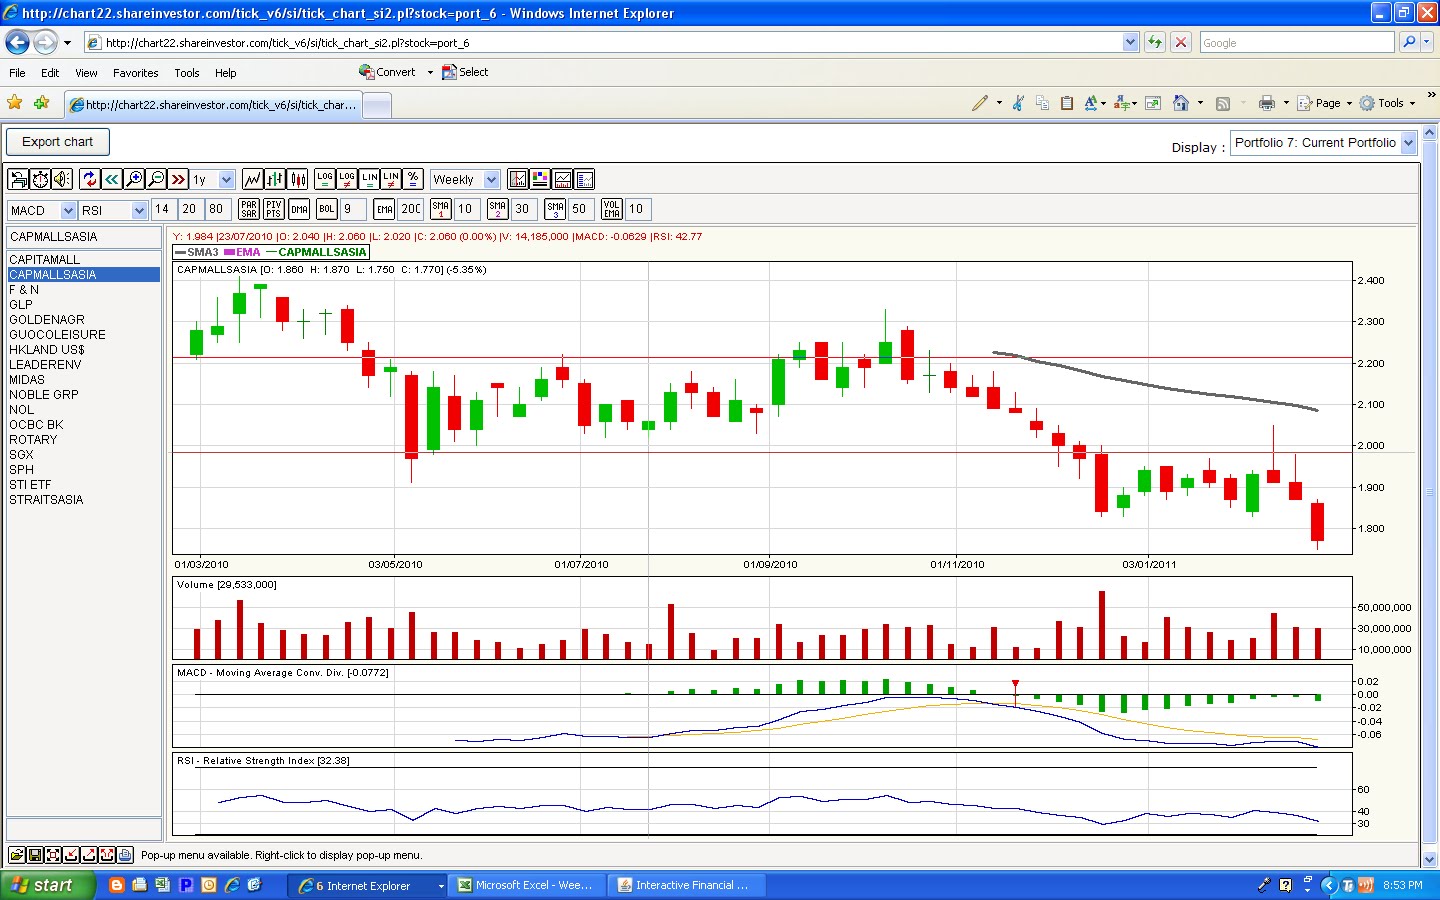
Weekly charts with warning signals and proposed exit level(s) before deep correction - Part 5


Labels: Historical Teachings
Weekly charts with warning signals and proposed exit level(s) before deep correction - Part 4


Labels: Historical Teachings
Weekly charts with warning signals and proposed exit level(s) before deep correction - Part 3


Labels: Historical Teachings
Weekly charts with warning signals and proposed exit level(s) before deep correction - Part 2


Labels: Historical Teachings
Weekly charts with warning signals and proposed exit level(s) before deep correction - Part 1


Labels: Historical Teachings
My Mistakes Made Before This Massacre and Corrective Actions
My Mistakes Made Before This Massacre
only reading daily charts again and again every day, and being lazy to read weekly charts of indices, STI components and my own portfolio every Friday night, which led to missing warning signals sent by evident bearish candlesticks on the weekly charts before deep correction. weekly charts with warning signals and proposed exit levels will be uploaded later on.
Corrective Action
1. Created a separate portfolio in SI to contain all current stocks I hold so that I am able to read daily, weekly, monthly and hourly charts conveniently by just pressing the "down" arrow around 20 times for each kind of chart to avoid being lazy again (by removing reason for being lazy).
2. Marked "to read weekly charts of indices, STI components and my own portfolio" on all Fridays in 2011 in my home calendar to remind myself since I have the habit to write things to do in the calendar and read them every day.
Labels: Historical Teachings, Thoughts
24 February 2011
as advised, do not buy, wait for development and completion of bottom formations. It's time for the market to do that since RSI for STI and most stocks are closer and closer to 20! which means that market is approaching its extreme.if you really want to buy badly, buy STI ETF only which is the only thing you can buy and average down.
Labels: Thoughts
what to do after deep correction?
1. hold and do not sell blue chips and wait for rebound.
it does not make sense to sell in desperation after deep correction.
2. do not buy yet.
wait for MACD sends buy signal first, then watch if bottom formations are developing on STI and its component stocks and if bullish candle sticks are appearing on the weekly charts and if bullish divergences are appearing on the daily charts. in this way we can avoid further potential correction.
3. buy once bottom formation breaks out with huge volume.
Labels: Thoughts
22 February 2011

21 February 2011

18 February 2011

ST ENGG
long position closed at 3.28, higher than CP 3.21.
rebounded to Fibonacci ratio 0.50 level from low.
Labels: Live Trading Records
17 February 2011

14 February 2011

STI weekly chart is bearish
technical rebounding is ongoing now, likley end at around 3185 in coming sessions.
strategy: sell into strength near 3185.
Labels: Charts

11 February 2011
08 February 2011
Below explains recent sharp divergence between US and HongKong / Singapore. HK got firm insider news.
China hikes interest rates again to damp inflation
The People's Bank of China announced Tuesday on its website that the benchmark 1-year deposit rate would rise by a quarter percentage point to 3 percent and the 1-year lending rate would increase by the same amount to 6.06 percent. The increases are effective Wednesday.
Labels: News
BOUGHT 200,000 of Sterling Pound against Japanese Yen (JPYSS) @ 132.89
CP 132.48, TP 133.23
--- stopped out in 2 hours time. I'd better stop trading forex before losing 10k.
CP 132.48, TP 133.23
--- stopped out in 2 hours time. I'd better stop trading forex before losing 10k.
Labels: Live Trading Records - Forex
07 February 2011
Realized Profit in Jan 2011 - Stocks
DATE CONTRACT NO. MODE A STOCK NAME QTY BUY PRICE SELL PRICE PROFIT
(S$)
10/11/2010 769299/001 CSH B Jaya Hldg 25000 0.750 - -
31/01/2011 165971/501 CSH S Jaya Hldg 25000 - 0.695 -1501.62
02/12/2010 890660/001 CSH B STATSChP 9000 0.905 - -
31/01/2011 165958/501 CSH S STATSChP 9000 - 0.860 -466.56
13/10/2010 599338/007 CSH B Fuxing 27000 0.160 - -
07/01/2011 056782/506 CSH S Fuxing 27000 - 0.190 751.70
23/11/2010 841673/008 CSH B Yongnam 27000 0.275 - -
07/01/2011 053468/512 CSH S Yongnam 27000 - 0.310 883.48
02/12/2010 892385/024 CSH B CoscoCorp 10000 2.090 - -
05/01/2011 037844/506 CSH S CoscoCorp 10000 - 2.280 1746.85
03/12/2010 897121/001 CSH B SIA Engg 7000 4.260 - -
05/01/2011 035924/502 CSH S SIA Engg 7000 - 4.420 907.09
03/12/2010 899186/011 CSH B Yangzijiang 11000 1.890 - -
05/01/2011 038621/512 CSH S Yangzijiang 11000 - 2.020 1279.29
02/12/2010 891631/013 CSH B Noble Grp 7000 2.090 - -
06/01/2011 045366/501 CSH S Noble Grp 7000 - 2.280 1222.81
02/09/2010 369654/001 CSH B SATS 10000 2.810 - -
06/01/2011 044058/504 CSH S SATS 10000 - 2.900 699.92
26/11/2010 866811/004 CSH B InnoTek 24000 0.555 - -
10/01/2011 060984/502 CSH S InnoTek 24000 - 0.600 982.87
15/12/2010 948674/001 CSH B China XLX 37000 0.605 - -
11/01/2011 072379/504 CSH S China XLX 37000 - 0.570 -1447.35
31/12/2010 013197/002 CSH B Noble Grp 8000 2.160 - -
11/01/2011 070991/509 CSH S Noble Grp 8000 - 2.330 1234.14
25/11/2010 863228/001 CSH B UtdEnvirotech 20000 0.405 - -
11/01/2011 070880/505 CSH S UtdEnvirotech 20000 - 0.480 1435.49
23/11/2010 844970/001 CSH B UOL 4000 4.760 - -
13/01/2011 086349/503 CSH S UOL 4000 - 5.040 982.64
05/01/2011 039746/001 CSH B ChinaMinzhong 15000 1.380 - -
14/01/2011 094967/504 CSH S ChinaMinzhong 15000 - 1.460 1050.70
03/01/2011 019072/005 CSH B CoscoCorp 7000 2.170 - -
18/01/2011 106203/508 CSH S CoscoCorp 7000 - 2.340 1079.38
15/12/2010 946825/007 CSH B DMX Tech 33000 0.415 - -
18/01/2011 105289/502 CSH S DMX Tech 33000 - 0.450 1054.97
24/09/2010 491753/005 CSH B Longcheer 7000 0.785 - -
24/01/2011 134054/501 CSH S Longcheer 7000 - 0.460 -2332.93
TOTAL PROFIT (S$) 9562.87
(US$)
10/12/2010 928746/001 CSH B HKLand US$ 2000 7.040 - -
05/01/2011 037493/501 CSH S HKLand US$ 2000 - 7.560 937.68
TOTAL PROFIT (US$) 937.68
Labels: Live Trading Records
Chinese New Year Thoughts
Stocks - plan to focus on blue chips especially STI components in trading. to risk 0.50% of trading capital for blue chips per trade, 0.25% for non-blue chips.
Forex - plan to focus on 7 majors and EURGBP, EURJPY, GBPJPY in trading. to risk 0.25% of trading capital per trade (0.50% before). need more practice.
Labels: Thoughts
CapitaComm
long position closed at TP 1.49 (excluding dividend of S$0.0393 per unit)
long position closed at TP 1.49 (excluding dividend of S$0.0393 per unit)
Labels: Live Trading Records
01 February 2011


CHFJPY LONG POSITION STOPPED OUT AT 86.73

all forex positions, long or short, closed.
I realized again that risk in trading forex is tremendous!
I realized again that risk in trading forex is tremendous!
Labels: Live Trading Records - Forex
![]()