27 August 2013
EIDO - iShares MSCI Indonesia ETF
Started to accumulate stock index ETF - EIDO (iShares MSCI Indonesia ETF) at US$23.71 per unit on 26 Aug 2013.
Reasons
PE at 15.8, neither cheap nor expensive; Price NAV ratio at 0.80, cheap; 5-year high at 36.5, paid price 23.71 is cheap at 65% of it;
An intermediate correction from 36.5 to 23.01 in the form of three waves ABC likely close to completion;
Daily chart RSI 14 is about 20, oversold;
MACD also at oversold area, below or close to 1 year, 2 years, 5 years low.
I'm almost in cash position, it is time to begin to accumulate by probing buy for expected technical rebound.
Basic Information on EIDO - iShares MSCI Indonesia ETF
Top 10 Holdings (56.01% of Total Assets)
Company Symbol % Assets
Astra International Tbk ASII 10.29
PT Bank Central Asia Tbk BBCA 8.95
Telekomunikasi Indonesia (Persero) Tbk Class B TLKM 7.41
Bank Rakyat Indonesia (Persero) Tbk Class B BBRI 6.25
PT Bank Mandiri Persero Tbk BMRI 6.10
Perusahaan Gas Negara (Persero) Tbk Class B PGAS 4.55
Semen Indonesia Tbk SMGR 3.68
PT Unilever Indonesia Tbk UNVR 3.41
PT CHAROEN PPOKF 2.76
INTEGRATED PHARM INC INTP 2.61
Ratio
Average Price/Earnings 15.80
Average Price/Book 3.16
Average Price/Sales 2.28
Average Price/Cash flow 6.93
Labels: Elliot Wave Analysis, ETF, Live Trading Records, Thoughts
22 August 2013
INDY - iShares S&P India Nifty 50 Index ETF
Started to accumulate stock index ETF - INDY (iShares S&P India Nifty 50 Index ETF) at US$18.87 per unit on 21 Aug 2013.
Reasons
PE at 13, neither cheap nor expensive; Price NAV ratio at 0.59, cheap; 5-year high at 33, paid price 18.87 is cheap at 57% of it;
a clear 5 downward waves structure is almost complete, which is bearish itself. But this is also implied that a significant technical rebound is likely to happen as per Elliott Wave Theory;
Daily chart RSI 14 is very close to 20, oversold;
MACD is also oversold close to or below 1 year, 2 years and 5 years low.
I'm almost in cash position, it is time to begin to accumulate by probing buy for expected technical rebound.
Basic Information on INDY - iShares S&P India Nifty 50 Index ETF
Top 10 Holdings (59.01% of Total Assets)
Company Symbol % Assets
I T C LTD ITC.BO 10.22
Reliance Industries Ltd. RELIANCE.B 7.80
INFOSYS LTD.-ORDINARY INFY.BO 7.79
HOUSING DEVELOPMENT FINANCE CO HDFC.BO 6.81
HDFC Bank Ltd HDFCBANK.B 6.17
ICICI Bank Ltd ICICIBANK. 5.76
TCS LTD TCS.BO 5.05
Larsen & Toubro Limited LT.BO 3.78
Tata Motors Ltd TATAMTRDVR 2.83
ONG CORP LTD ONGC.BO 2.80
Ratio
Average Price/Earnings 12.94
Average Price/Book 2.01
Average Price/Sales 1.33
Average Price/Cash flow 8.66
Labels: Elliot Wave Analysis, ETF, Live Trading Records, Thoughts
20 January 2008
DOW
just read dow's chart, I guess dow could have a chance to stage a strong rebound to 12900 from 12000 in coming weeks. but we can only view this oversold rebound as a technical rebound (pulling back to neckline of the head and shoulders formation after breakdown on the weekly chart of dow to test validity of the breakdown of this SHS) for squaring off all long positions and preparing for shorting near there subject to confirmation of downtrends on both daily chart and hourly chart of dow.
STI
wave A of the bear market in form of 5 clear impulsive waves could have completed at 3008, wave B rebound (suckers' rally) could have started from 3008.
Strategy
buy important STI components when it approaches 3008 again, if possible.
STI wave B rebound (suckers' rally) target: 3457 / 3562
STI resistance: 3300 could be significant in short term.
Labels: Charts, Elliot Wave Analysis
12 May 2007
STI
down gap on the hourly chart fully backfilled at 3463, high 3464 so far today, watch what Mr Market will do next.
Elliot wave analysis shows that 5 impusive structure starting from low of 2931 on 05 Mar 07 almost in place, tg 3567 almost hit ( high 3523 so far, only 44 points short of). does not exclude one more push up to 3567 before a real correction.
on the other hand, STI breached two fan lines drawn from low of 2931 on 05 Mar 07. if it breaches one more in coming sessions / weeks, STI will die already!
Pattern analysis shows that STI's rising wedge is at its terminal stage.
STI's MACD has a double divegences with STI.
all above 4 points point to a bearish view on STI.
pls refer an analysis quoted from my blog,
*/search/label/Elliot%20Wave%20Analysis
Quote:
STI Elliot Wave Analysis
monthly chart: 5 up waves I II III IV V in terminal stage - tail of the super bull market that started from SARS low cum US Invading Iraq War low in Mar 2003.
wave I up: 1205 (month ended on 31 Mar 03) to 1912 (month ended on 30 Jan 04)
wave II correction: 1912 (month ended on 30 Jan 04) to 1690 (month ended on 31 May 04)
wave III up: 1690 (month ended on 31 May 04) to 2399 (month ended on 31 Aug 05)
wave IV correction: 2399 (month ended on 31 Aug 05) to 2278 (month ended on 30 Jun 06)
wave V up: 2278 (month ended on 30 Jun 06) to ? (>3316)
wave V consists of 5 extended waves (1) (2) (3) (4) (5) which can be seen on the weekly chart only instead of on the monthly chart, in which waves (1) (2) (3) of wave V had completed, current intermediate correction is wave (4) of wave V. there will be wave (5) (up) of wave V after wave (4) of wave V completes in due course to complete whole wave V thus complete all waves I II III IV and V. wave (4) of wave V likely to be a symmetrical triangle consisting of sub-sub-waves abcde 5 waves, which is a complicated wave. There are many ups and downs within wave (4) of wave V - good stuffs for short term technical traders. wave (4) of wave V targets 2797 / 2675.
wave (4) of wave V had completed at 2931 on 05 Mar 07.
wave (5) of wave V starting from 2931 on 05 Mar 07, which can be divided into 5 smaller waves 1 2 3 4 5. waves 1 2 3 4 of wave (5) of wave V had completed, wave 5 of wave (5) of wave V still in progress, my tg is 3567.
I expect a huge correction after wave 5 of wave (5) of wave V completes.
Labels: Elliot Wave Analysis
02 May 2007
STI
breakout of a minor symmetrical triangle correcting formation today, signaling completion of wave 4 of a 5 impulsive up waves starting from 2931 on 05 Mar 07.
finally, terminal stage of the bull market started, target 3567 in short term.
after that, a major correction in form of a symmetrical triangle correcting formation lasting 1 year or so similar to that from 08 Mar 2002 to 14 Mar 2003 will initiate and will cause huge damages to bulls (drop about 34%).
Labels: Elliot Wave Analysis
06 March 2007
CG Tech Elliot Wave Analysis
weekly chart: waves (1) (2) (3) completed, wave (4) started from .845 and is in progress, which will correct the whole wave (3) (.24 to .845), tg of wave (4) correction is .545 / .47. but do note that the correction is not a straight line, wave A of wave (4) almost done, wave B rebound will follow soon, do not worry too much, you have opportunity to exit / cut near high of wave B that targets .725 / .755.
weekly chart: waves (1) (2) (3) completed, wave (4) started from .845 and is in progress, which will correct the whole wave (3) (.24 to .845), tg of wave (4) correction is .545 / .47. but do note that the correction is not a straight line, wave A of wave (4) almost done, wave B rebound will follow soon, do not worry too much, you have opportunity to exit / cut near high of wave B that targets .725 / .755.
Labels: Elliot Wave Analysis
STI Elliot Wave Analysis
monthly chart: 5 up waves I II III IV V in terminal stage - tail of the super bull market that started from SARS low cum US Invading Iraq War low in Mar 2003.
wave I up: 1205 (month ended on 31 Mar 03) to 1912 (month ended on 30 Jan 04)
wave II correction: 1912 (month ended on 30 Jan 04) to 1690 (month ended on 31 May 04)
wave III up: 1690 (month ended on 31 May 04) to 2399 (month ended on 31 Aug 05)
wave IV correction: 2399 (month ended on 31 Aug 05) to 2278 (month ended on 30 Jun 06)
wave V up: 2278 (month ended on 30 Jun 06) to ? (>3316)
wave V consists of 5 extended waves (1) (2) (3) (4) (5) which can be seen on the weekly chart only instead of on the monthly chart, in which waves (1) (2) (3) of wave V had completed, current intermediate correction is wave (4) of wave V. there will be wave (5) (up) of wave V after wave (4) of wave V completes in due course to complete whole wave V thus complete all waves I II III IV and V. wave (4) of wave V likely to be a symmetrical triangle consisting of sub-sub-waves abcde 5 waves, which is a complicated wave. There are many ups and downs within wave (4) of wave V - good stuffs for short term technical traders. wave (4) of wave V targets 2797 / 2675.
Labels: Elliot Wave Analysis
22 May 2006
STI Long Term Waves Analysis (22 May 06)
Based on STI long term chart, it is possible that wave (3) have completed at 2666 since it consisted 5 up waves, very clear, very beautiful. Currently, it is possible that STI is doing wave (4), which may well be a symmetrical triangle correction formation in the form of ABCDE 5 waves, and wave A of wave (4) is still to complete, wave a of Wave A has just completed, then Wave b of Wave A will follow suit. Then wave c of Wave A will begin. Since wave a is very sharp, wave b will be small and long, wave c will be the same size as wave a or 1.618 times of wave a. My general feeling is that do not need to be too worrisome. This is not the end of the world. Many opportunities will appear during the whole correction process (wave (4)) though not big. Let's prepare to catch up with the up waves in wave (4), cheers!
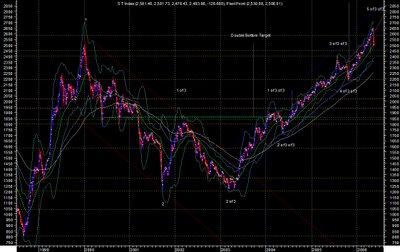
Chart from
http://thoughts-denzuko1.blogspot.com/
Labels: Elliot Wave Analysis
STI
Hourly charts indicates the possibility of a B-wave technical rebound occurring this week that could retrace 38.2% to 50% of the index''s fall from 2666, which should lift it back to the 2550 to 2572 range.

Hourly charts indicates the possibility of a B-wave technical rebound occurring this week that could retrace 38.2% to 50% of the index''s fall from 2666, which should lift it back to the 2550 to 2572 range.

Labels: Elliot Wave Analysis
![]()