30 September 2006
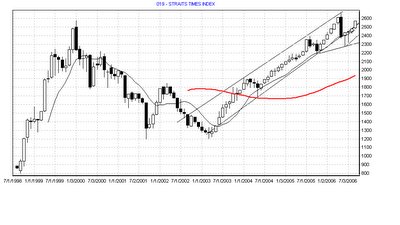
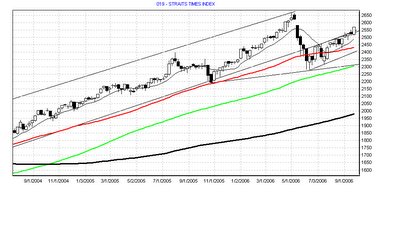
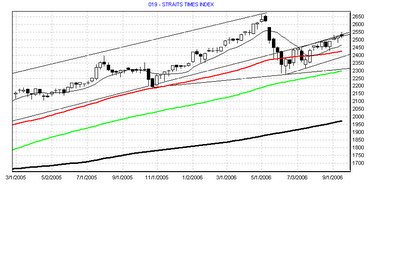
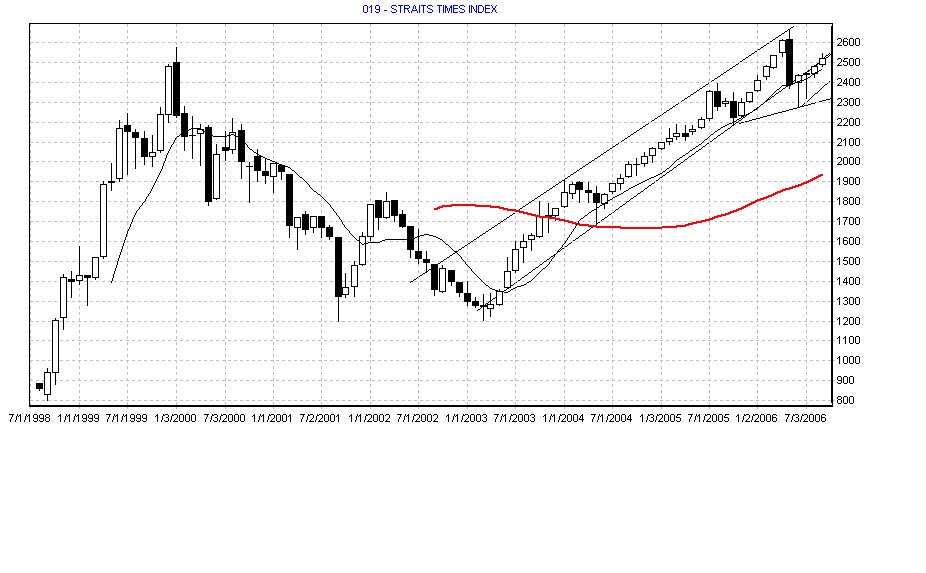
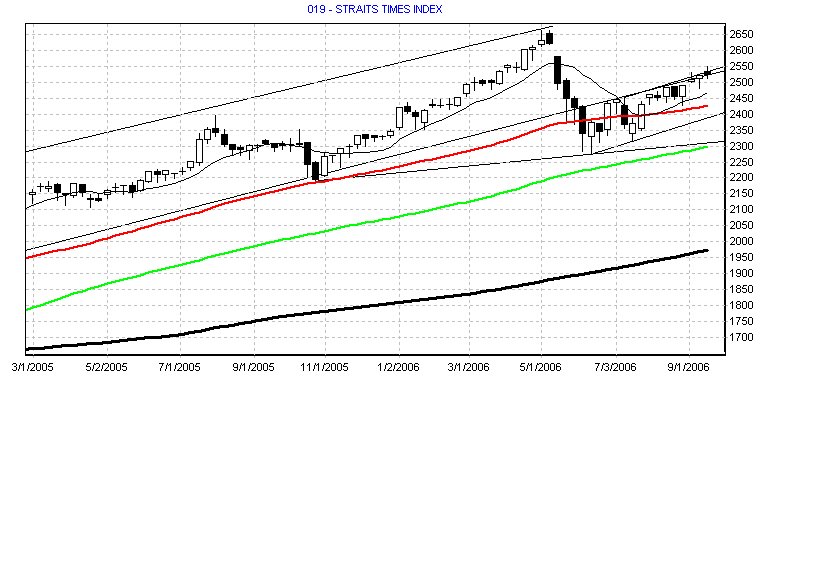
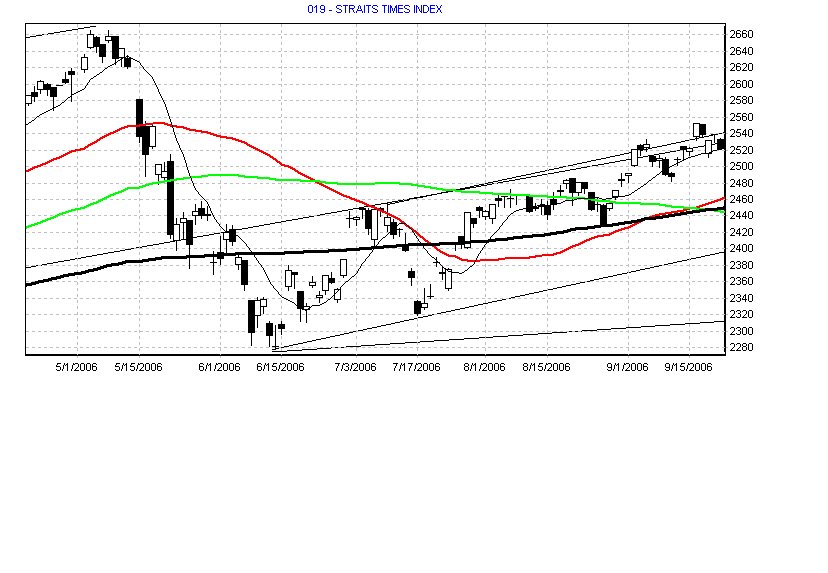
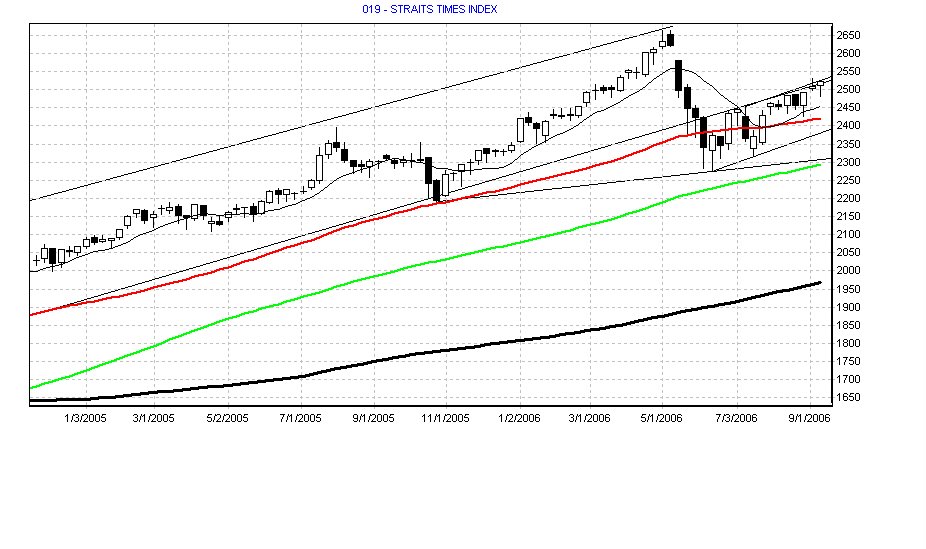
STI - Monthly / Weekly / Daily Charts (30 Sep 06)


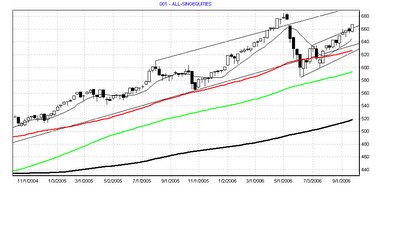
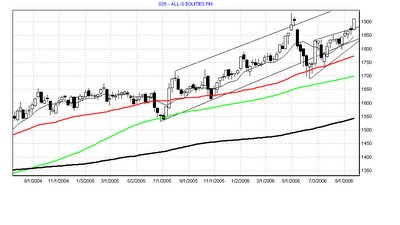
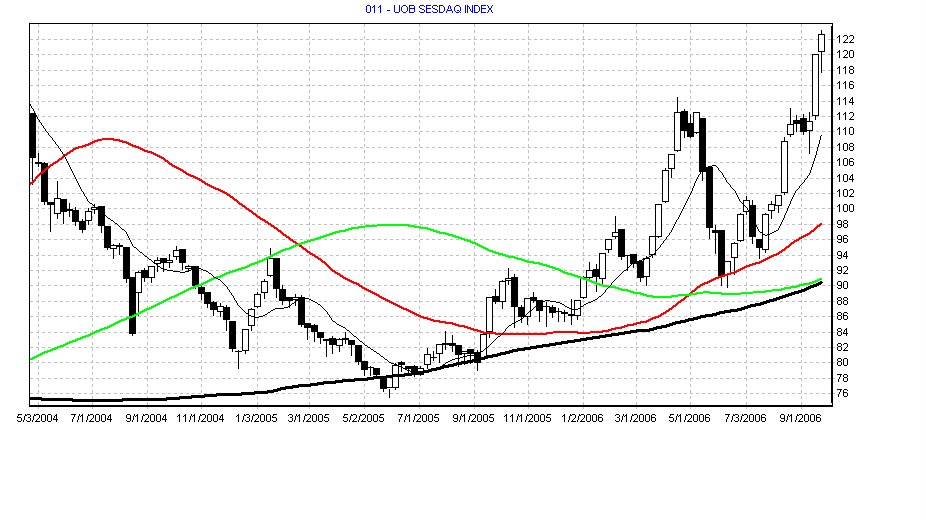
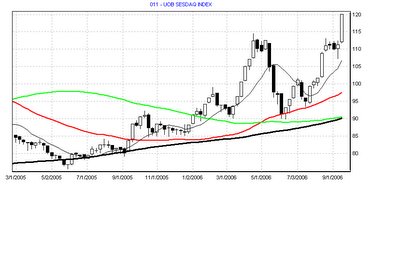
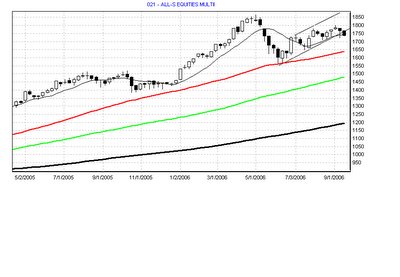
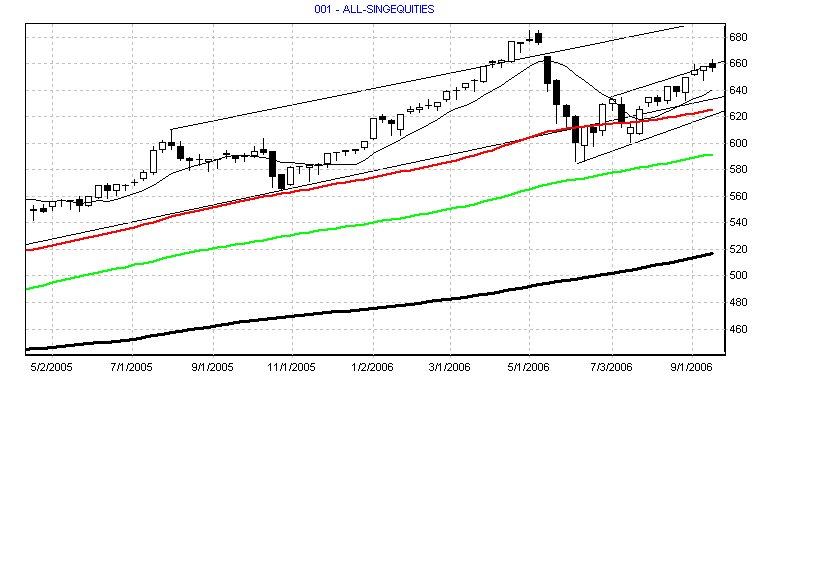
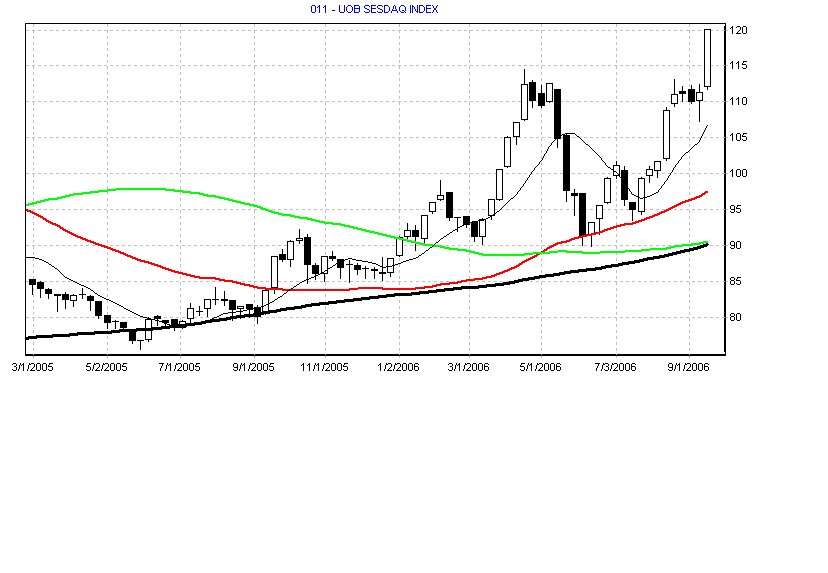
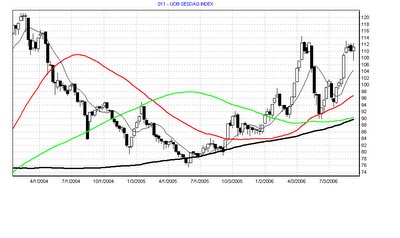
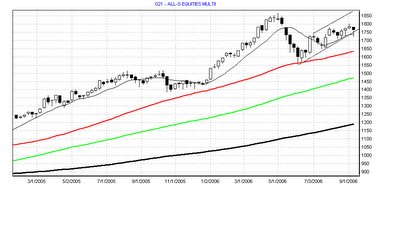
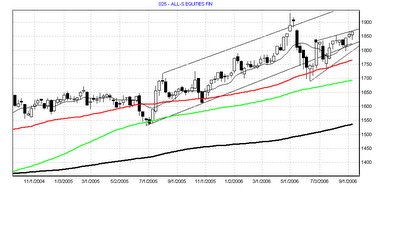
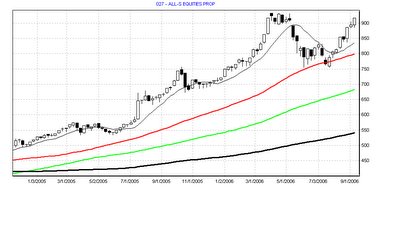
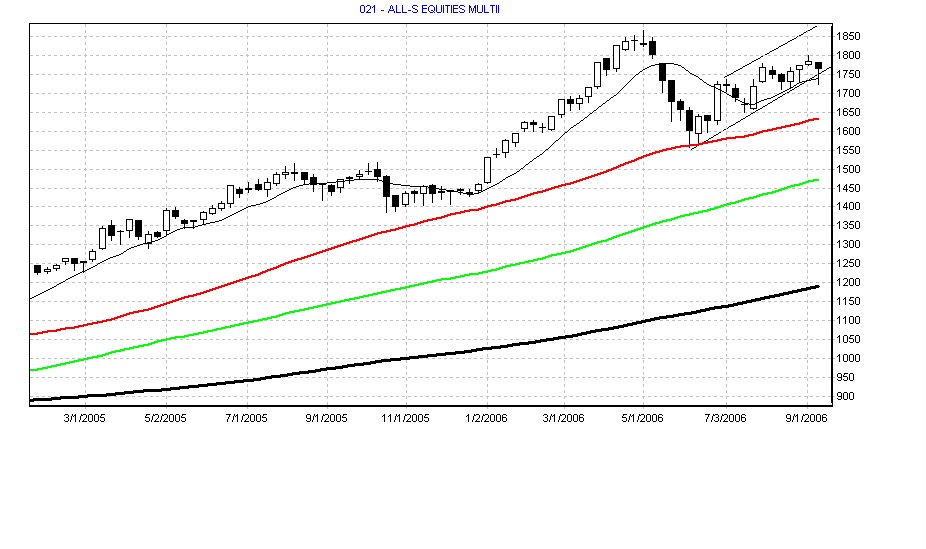
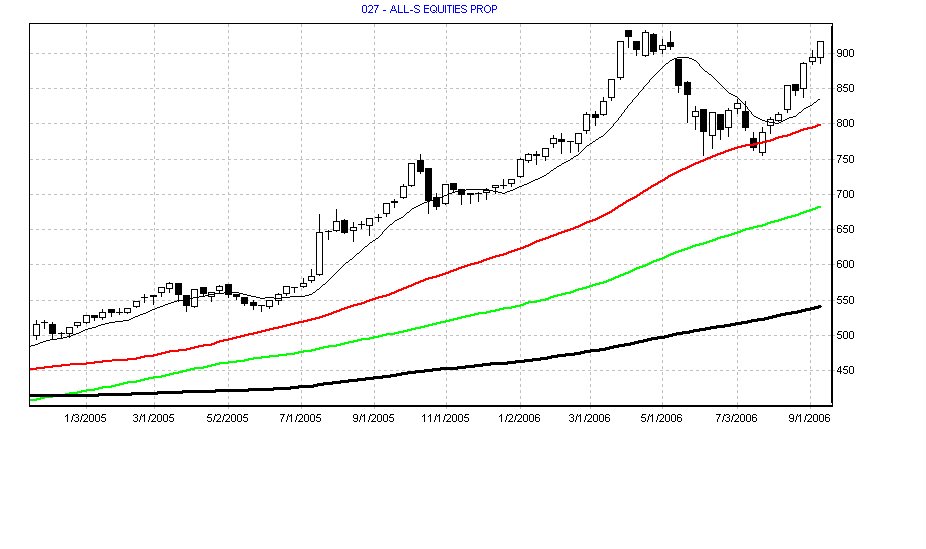
Other SGX Indices - Weekly Charts (30 Sep 06)


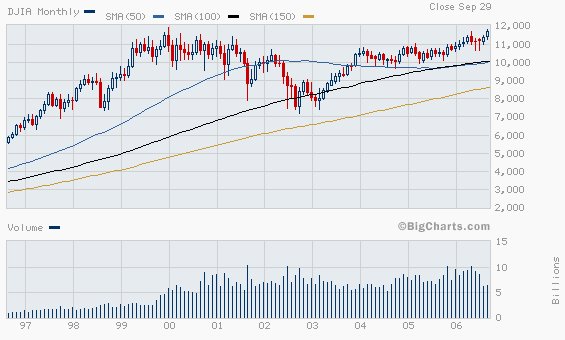
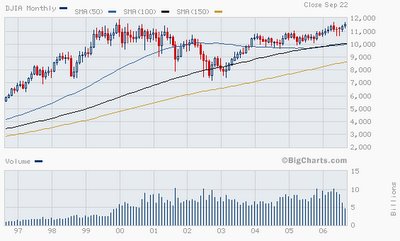
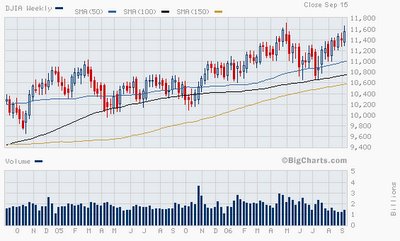
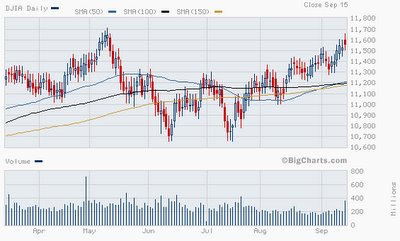
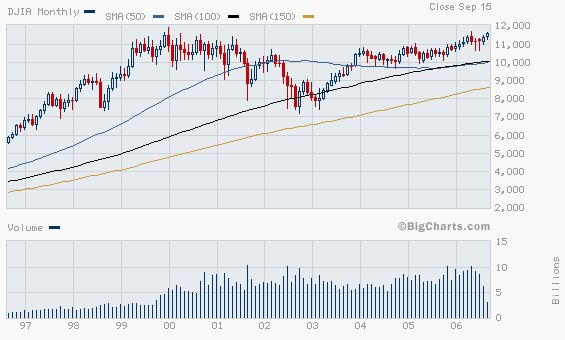
Dow 30 - Monthly / Weekly / Daily Charts (30 Sep 06)


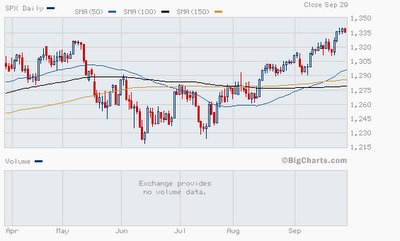
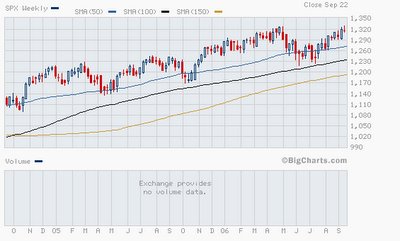
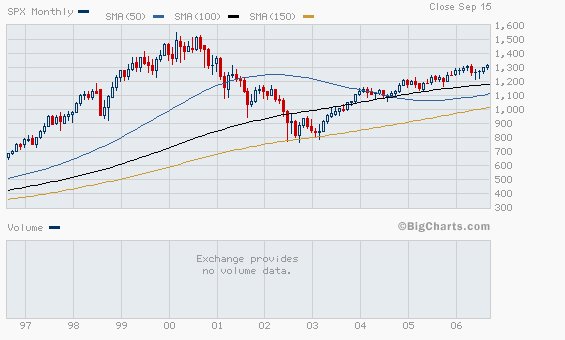
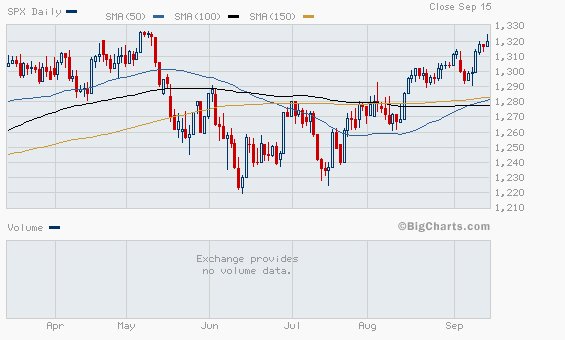
S & P 500 - Monthly / Weekly / Daily Charts (30 Sep 06)


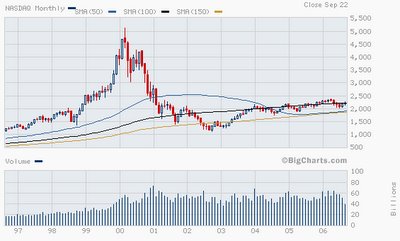
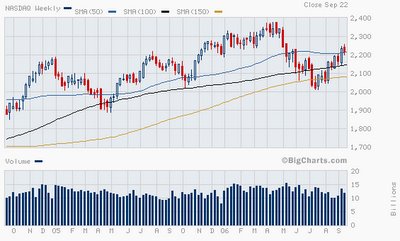
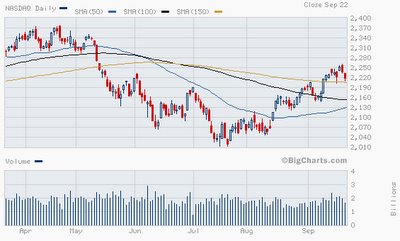
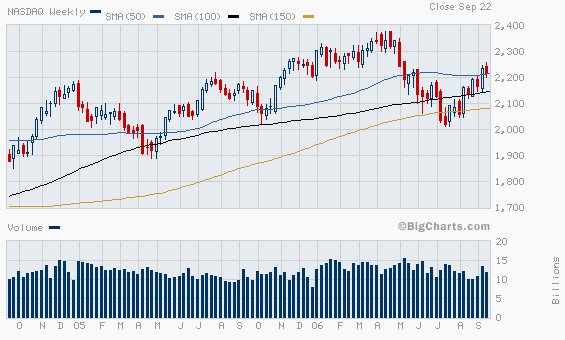
Nasdaq Composite - Monthly / Weekly / Daily Charts (30 Sep 06)


24 September 2006
STI Analysis from Sunnymugg (24 Sep 06)
"If you look at the attached chart of the STI as at 22 Sep 2006, you will see that we are fast approaching the end of a diagonal triangle, all the internal wave counts appearing to conform nicely with the respective structural rules. This explains why the STI has been struggling upwards with overlapping waves and choppy price movements the past couple of weeks. I also believe this is a terminal rather than a leading triangle based on the higher degree wave structures.
[/img]http://img236.imageshack.us/img236/905/sti22sep06js5.th.jpg[img]
If this is so, we can expect the STI next week to complete wave 4 by falling a further 20 points to 2500 at the lower trendline before recovering into a wave5 rally that should take the STI back up to around 2580 - 2600. There is a Fib 78.6 retracement level at 2583.21 and a Fib 161.8 extension level at 2608.02. This should complete Wave(B) of Wave[4] and should be followed by a precipitous decline into Wave(C) of Wave[4] thereafter.
Nothing about the above should come as a surprise to anybody who is slightly technically inclined. If I can see this developing, plenty of other people are probably expecting it as well. In some ways, it all seems too obvious, too easy to be true. Nevertheless, this is my best guess and should be so regarded as I could also be very wrong indeed. That said, I am preparing to sell my remaining holdings very soon."
This is the best STI analysis I've seen so far.

23 September 2006
STI - Monthly / Weekly / Daily Charts (23 Sep 06)


Other SGX Indices - Weekly Charts (23 Sep 06)


Dow 30 - Monthly / Weekly / Daily Charts (23 Sep 06)


S & P 500 - Monthly / Weekly / Daily Charts (23 Sep 06)


Nasdaq Composite - Monthly / Weekly / Daily Charts (23 Sep 06)


16 September 2006
STI - Monthly / Weekly / Daily Charts (16 Sep 06)


SGX Indices - Weekly Charts (16 Sep 06)


Dow 30 - Monthly / Weekly / Daily Charts (16 Sep 06)


S & P 500 - Monthly / Weekly / Daily Charts (16 Sep 06)


Nasdaq Composite - Monthly / Weekly / Daily Charts (16 Sep 06)


![]()