29 July 2006
Dow 30 - Daily / Weekly / Monthly Charts (29 Jul 06)
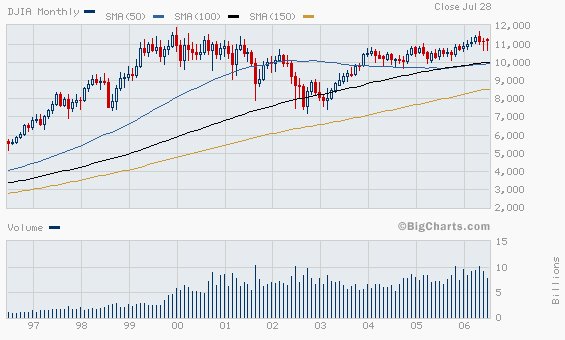
Monthly - candles with long lower shadows for 2 months show that a bottom has been identified.
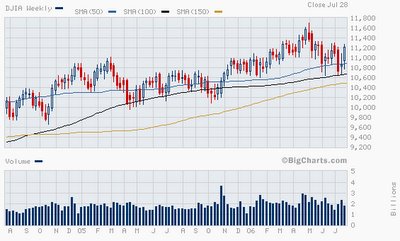
Weekly - Morning star + long cross, a db in place?
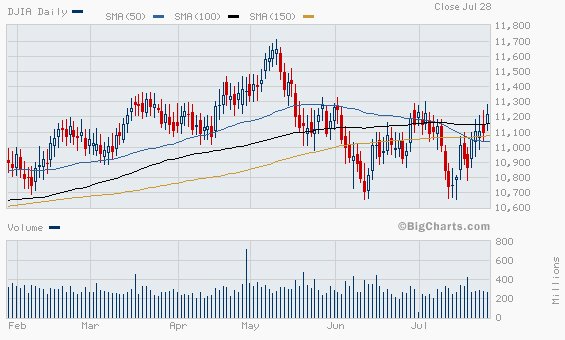
Daily - a db formation will be confirmed once 11300 is broken out with heavy volume
Comment : US markets are always surprisingly resilient. Feeling they are still the best places to trade in in the world.
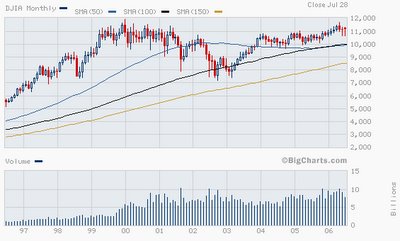

Monthly - candles with long lower shadows for 2 months show that a bottom has been identified.
Weekly - Morning star + long cross, a db in place?
Daily - a db formation will be confirmed once 11300 is broken out with heavy volume
Comment : US markets are always surprisingly resilient. Feeling they are still the best places to trade in in the world.

![]()