01 July 2006
Nasdaq Charts - Daily / Weekly / Monthly
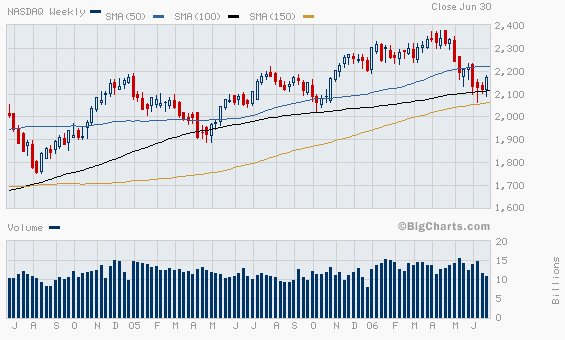
Nasdaq daily chart - DB breakout with volume, but likely to consolidate in short term since volume is heavier when Nasdaq corrected on the next day after breakout, demonstrating that there are many hesitating positions in the market. Major bulls need to flush out those hesitating positions first before they can forge ahead, indicating by swift volume contractions during expected correction towards db neckline.
Note that Nasdaq fell starting from May 06 in form of 5 down waves, hinting that bear market is in place and wave A had completed at around 2060, recent low. 2310 is the maximum level the expected technical rebound or sucker rally or wave B can reach. Note there is a shs sitting above there. Do not expect too much.
FTSE 100 and Nikkei 225 - has similar chart pattern to Nasdaq, 5 down waves, indicating a long term bear market is in place and a technical rebound is in progress at this moment.


Comments:
Post a Comment
<< Home

<< Home
![]()