10 October 2018
How to Profit From the Head and Shoulders Pattern
By Justin Bennett
https://dailypriceaction.com/free-forex-trading-lessons/head-and-shoulders-pattern
The head and shoulders pattern is by far my favorite way to trade reversals in the Forex market. They don’t come around often but when they do the profits can be considerable.
It isn’t abnormal to see moves of 500 pips or greater from these patterns. We’ll take a look at one that formed on the GBPJPY that resulted in a very profitable 1,800 pips.
But what actually qualifies as a head and shoulders? Where should it form on a chart and what attributes does it need to have?
Exclusive Bonus: Download the Head and Shoulders PDF Cheat Sheet that will show you everything you need to know to make money from this reversal pattern.
Then there are the questions about entries, exits and of course the often-confusing measured objective. All of these unknowns can lead to an endless stream of confusion.
If you find yourself asking these same questions, then you’re in luck.
By the time you finish this lesson, you will know how to identify the very best reversals and how to enter and exit for a profit. I’ll even show you how to determine a measured objective so you can squeeze out as much profit as possible while managing your risk.
Let’s begin.
Key Attributes of the Head and Shoulders Pattern
Before you can trade it, you must first know the key attributes of the pattern. That way you can easily spot the most favorable head and shoulders to trade.
Let’s start with the illustration below.
head-and-shoulders-pattern
As you can see from the drawing above, the head and shoulders pattern has five attributes.
In order of occurrence, they are:
Uptrend
Left shoulder
Head
Right shoulder
Neckline
Notice that I placed the “neckline” last. At first, that may seem like a mistake.
However, we need both shoulders and the head of the pattern before we can identify the neckline. If that sounds confusing, don’t worry. It will make more sense as you progress through the lesson.
Now let’s discuss each step in greater detail.
Step 1: Uptrend
The very first part of a head and shoulders pattern is the uptrend. This is the extended move higher that eventually leads to exhaustion.
As a general rule, the longer the uptrend lasts, the more substantial the reversal is likely to be.
Step 2: Left shoulder
The market moves down to form a higher low. At this point, things are starting to come together, but we don’t quite have enough to draw the neckline.
Step 3: Head
Now that the left shoulder has formed, the market makes a higher high which forms the head. But despite the bullish rally, buyers are unable to make a substantially higher low.
At this point, we have the left shoulder and the head of the structure. The neckline is also beginning to take shape, but we need the right shoulder before we can draw the neckline on our chart.
Step 4: Right shoulder
The right shoulder is where things come together. It’s an indication that buyers are tiring and that the market may be gearing up for a reversal.
As soon as the right shoulder begins, we have enough to start plotting the neckline. But because the pattern isn’t yet complete, it’s best to think of it as a rough draft rather than a final version.
Step 5: Neckline
Now that we have a defined head and two shoulders we can draw neckline support. This level will become a key component when we get into how to trade the breakout.
Think of the neckline as the line in the sand between buyers and sellers.
What Is It and Why Does It Form?
All price action carries with it a message. Some messages are easier to read than others, but they’re always present.
Concerning the head and shoulders pattern, the message is that buyers are tiring and that you’d best prepare for a potential reversal.
But what is it about the pattern that causes the market to reverse? How can a few simple swing highs accomplish this?
These are the kind of questions that will help you unlock the clues and take you to the next level.
But there’s a problem…
The way I phrased the two questions above fails to capture the essence of the head and shoulders pattern.
You see, it isn’t the price structure itself that causes the market to reverse. It’s the transition that occurs between buyers and sellers. The pattern is just the outcome or byproduct of that process.
To better explain things let’s look at it from a different perspective. For this, we’re going to use a real head and shoulders formation that occurred on the GBPJPY weekly chart.
gbpjpy-head-and-shoulders-reversal
Notice how after carving out a higher high (head) and pulling back, buyers were unable to push the price back above the head. This eventually formed the right shoulder.
The lower high would be a big red flag if you were a GBPJPY bull during this time.
Let’s take another look at the same GBPJPY chart.
gbpjpy-highs-and-lows
If you’ll remember from the lesson on how to determine trend strength, the telltale sign of an impending trend change is a shift in the sequence of highs and lows.
For example, a market that’s been carving out higher highs and higher lows may be in trouble with a single lower high.
However, a trend is not technically broken until we get a lower high and a lower low. Note how the price action inside the second red circle above took out the last swing low.
As soon as that low was taken out, the GBPJPY signaled that buyers were in trouble.
The head and shoulders reversal doesn’t work because of the pattern itself. It works because of the way in which the highs and lows develop and interact with each other at the top of an uptrend.
Always remember to keep it simple. All we’re doing here is identifying a potential shift in trend by focusing on the relationship between highs and lows.
Head and Shoulders Breakout
One important thing to keep in mind about the head and shoulders pattern is that it’s only confirmed on a break of neckline support.
And by break, I mean a close below it.
A common mistake among Forex traders is to assume the pattern is complete once the right shoulder forms.
In fact, it’s only complete and thus tradeable once the market closes below the neckline.
head-and-shoulders-breakout
Notice in the illustration above that the market has closed below the neckline. This confirms the head and shoulders pattern and also signals a breakout.
Pro Tip: If you are on the daily chart, you would want to wait for a daily close below the neckline before considering an entry.
Now let’s go back to our GBPJPY example to see where the pattern was confirmed.
gbpjpy-confirmed-reversal
Notice how it took a daily close below neckline support to constitute a confirmed break. While there were a few previous sessions that came close to breaking the level, they never actually closed below support.
Next, we’ll discuss a few entry methods for trading the head and shoulders.
How to Enter a Break of Neckline Support
So far in this lesson, we have covered the five attributes of a head and shoulders pattern. We have also discussed how to differentiate a formation that’s still intact versus one that has broken down.
Now for the really fun part – how to trade and of course profit from a head and shoulders reversal.
There are two schools of thought on how to enter a breakout. The first is to use a pending order to go short just below the neckline. Note that those who use this method are not waiting for the market to close below the neckline.
The problem with this approach is that you leave yourself exposed to the possibility of a false break. You’ll often see a pair dip below support on an intraday basis only to close back above the level before 5 pm EST.
Which brings us to the second approach, and the one I prefer. This method involves waiting for a daily close below the neckline before considering an entry.
By doing this, you mitigate the risk of having the market snap back on your position and stop you out for a loss.
Because of this, we’re only going to focus on the second approach. But even when waiting for the market to close below the neckline there are two entry methods to consider.
Let’s discuss each in detail.
Entry Method #1
The first way to enter a head and shoulders break is to sell as soon as the candle closes below support (neckline).
For example, because we’re analyzing the GBPJPY on the daily time frame, we’d wait for a daily close below the neckline. That would be our signal to go short (sell).
Here’s how that would look:
Enter on close below neckline
Notice how we’re entering short as soon as the pair closes below neckline support.
Entry Method #2
While the method above has its uses, I usually prefer to wait for a retest of the neckline as new resistance.
This brings us to the second entry method.
Enter on retest as new resistance
Notice how with the second entry method we’re waiting for a retest of the neckline as new resistance.
This accomplishes two things:
It helps validate the recent break
It offers a more favorable risk to reward ratio
This combination is why I almost always opt for the second method. There is, of course, a greater chance of missing an entry by waiting, but the potential reward for doing so is equally great.
Stop Loss Placement and Risk Control
Despite being straightforward, the stop loss placement when trading the head and shoulders is a controversial topic. Some traders prefer a stop above the right shoulder whereas others choose a more aggressive placement.
Like everything you do in the Forex market, it comes down to what works best for you.
With that said, I tend to believe that a stop loss above the right shoulder is excessive. It unnecessarily and adversely affects your risk to reward ratio.
Here’s why…
A head and shoulders is confirmed with a close below the neckline, right? So a close back above that same level would negate the pattern.
Now, assuming my stop is above the right shoulder, am I going to wait for the market to take me out if it closes back above the neckline?
Of course not.
So really there are three ways to exit the trade should things turn sour. Let’s start with the first and, in my opinion, less appealing way and then we’ll finish up with my two favorites.
Stop Loss Placement #1
The first area you can place your stop loss is above the right shoulder.
Stop loss placement1
Notice how this option provides an ample amount of space between your entry and stop loss.
However, this isn’t necessarily a good thing. I’d even argue that it does more harm than good. You see, a stop loss that high means you’ve also cut your potential profit in half or worse.
In the case of the GBPJPY pattern the measured objective, which we’ll get to next, is 1,800 pips below the breakout point. If you chose this first option to set your risk, it means you’d have a 500 pip stop. If we divide that into the objective, we get 3.6R.
That’s pretty good but let’s see what we could have had using the section option.
Stop Loss Placement #2
This is my preferred stop loss placement. It allows for a much better risk to reward ratio while still affording me the ability to “hide” my stop.
Here’s how it looks on the GBPJPY chart:
Stop loss placement2
Note that I’m placing the stop above the last swing high. This is still about 200 pips from my entry, so it’s hidden, but it isn’t so far away that it adversely impacts my potential reward.
You can always go tighter if you’d like as it all depends on what fits your trading style. Just remember that the closer your stop loss is to your entry the greater the chance of being taken out of the trade prematurely.
Remember the 3.6R profit with the first stop loss placement above?
By setting your stop above the last swing high instead, you’ve cut your stop loss distance from 500 pips down to 200 pips. With an 1,800 pip objective, that’s an incredibly profitable 9R.
To put it in hypothetical terms, that’s a 7.2% profit versus an 18% profit, assuming you risked 2% of your account balance on the trade.
Exit on Close above the neckline (Safety Net)
I call this my safety net. Because any daily close back above the neckline suggests invalidation. And I don’t know about you, but I’d rather take a 50 pip loss than a 100 pip loss.
Referring to the GBPJPY example above, if the market had closed back above the neckline after it closed below it, we would want to exit the trade. Such a close would signal that the pattern is no longer valid and that sellers are no longer in control.
In fact, this notion can be applied to just about any pattern you trade. It can help reduce the size of a loss in the event the market turns against you.
Profit Targets and Measured Objectives
Knowing when to take profit can mean the difference between a winning trade and a losing one. It’s arguably the most challenging aspect of trading.
When it comes to the head and shoulders pattern, there are two ways to approach it. And for some, a blend of the two may be the way to go.
Approach #1
The first and more conservative approach is to book profit at the first key support level. These are the areas you’ve defined that could cause the market to bounce. As such, it may be a good idea to take profit on a retest of one of these areas.
Because every situation is different, these support levels will vary. But the one thing that must always be true is a favorable risk to reward ratio. So always be sure to do the math before taking the trade.
Approach #2
The second and more aggressive approach is to use a measured objective.
Although using a measured objective is more aggressive as your target is further away from your entry, it’s also more universal.
Why is that, you ask?
When you use this method, you’re taking a measurement of the height of the entire pattern. So regardless of the situation, you will always have a specific target area.
Here’s one taken from the EURCAD daily chart:
Measured objective
Note that I measure from the top of the head directly below to the neckline. I then take that same distance and measure lower from the breakout point.
Measuring from this point is a small but significant detail, especially for necklines that develop at an angle.
One last note about measured objectives. Although they can be extremely accurate, they are rarely perfect. So as an added layer of defense, it’s best to think of them as general areas rather than specific levels.
Also, try to find a key support level that intersects with or at least comes close to the measured objective. This will help you validate the target area and give you a greater degree of confidence during the trade.
A Few More Examples and Explanations
Who doesn’t like more examples? I know I do.
So to start wrapping things up, here are a couple more examples of the head and shoulders in action.
Be sure to take note how each structure forms in its own unique way yet is still highly effective at signaling a reversal.
First up is the EURCAD daily chart.
eurcad-head-and-shoulders
Notice how in this case the measured objective lined up with a key pivot area. While it’s not required, this can add a greater degree of confidence to any trade idea resulting from the reversal.
The second reversal pattern formed on the USDJPY weekly time frame after a multi-year uptrend.
usdjpy-reversal-pattern
A significant difference here from the first EURCAD reversal is that the USDJPY neckline is a horizontal level. This is perfectly acceptable but isn’t very common.
In most cases, the neckline support will form at a diagonal. The pitch of the level can vary, but one thing must always be true – the level should move from lower left to upper right. Note the angle on the first EURCAD chart above.
Putting It All Together
Now let’s put everything you just learned together. The video below will walk you through the same EURCAD head and shoulders from start to finish.
A Few Key Insights Before You Go...
So by this point, you’re familiar with the attributes of the pattern, where to find it and most importantly, how to enter and exit for profit.
But there are a few key insights I want to share with you before you go. Think of these as rules to follow when trading the head and shoulders pattern.
Let’s get started.
The pattern must form after an extended move higher
This rule is self-explanatory. It can only be a bearish reversal pattern if it forms after an extended move higher.
One way to double check is to make sure there are no immediate swing highs to the left of the formation.
Take a look at the charts above. Notice all the white space to the left. That’s what you want to see when trading any bearish reversal pattern.
Neither shoulder can be above the head
You can’t raise your shoulders above your head, right?
For your sake, I hope not.
The same applies to this technical pattern. The head should always stick out above both the left and right shoulders. And while there’s no exact rule for the distance, it should be evident from a quick glance.
Pro Tip: If you have to question the validity of a pattern, it probably isn’t worth the risk.
The neckline should be horizontal or ascending but never descending
If you find a head and shoulders where the neckline moves from the top left to the bottom right, you may want to stay on the sidelines.
For example, if you see this:
Weak head and shoulders
It’s a sign of a “weak” reversal pattern. And while you may still enjoy a favorable outcome, the odds aren’t in your favor.
Instead, this is what you want to see:
Healthy head and shoulders
Note how the neckline is moving from lower left to upper right. This suggests a “healthy” head and shoulders pattern and one you probably want to keep an eye on.
In my experience, the steeper the angle of the neckline, the more aggressive the breakout and reversal is likely to be. Look no further than the GBPJPY example above.
The shoulders should be on the same horizontal plan
This one is a bit tricky to explain, so an illustration seems more appropriate.
Head and shoulders overlap
Notice how both the left and right shoulder “overlap” to some degree. Each shares a portion of the same horizontal plane. They don’t need to overlap entirely, but they do need to share a portion of the highlighted area above.
If you find a price structure that doesn’t fit this description, it isn’t technically a head and shoulders.
Stick to the daily and weekly time frames
Last but certainly not least are the time frames that tend to perform the best. After several years of trading these reversals, I can say with certainty that they are most reliable on the daily and weekly time frames.
While you can trade them on say a 1-hour or 4-hour chart, you run the risk of finding a lot of false positives. That is a pattern that looks like a head and shoulders but doesn’t perform like one.
To avoid this be sure to stick to the daily time frame and higher. After all, that’s where you can usually find the most consistent trends.
Final Words
There are many different ways to trade reversals in the Forex market, but few are as consistently profitable as the head and shoulders.
It isn’t just about trading a technical formation. It’s about “reading” the price action to understand the fundamental shift between buyers and sellers.
While there are no guarantees in the Forex market, the head and shoulders strategy you just learned is as close as it gets. Follow the guidelines above, and you’ll be well on your way to achieving consistent profits.
Labels: Chart Pattern, Forex
09 October 2018
Major Keys to Forex Trading Success
Credit: Brad Mitchell
Hey guys! I dropped quite a bit of knowledge in this group yesterday, and you guys seemed to love it. So, I decided to make another post! Without further ado, here are three HUGE pieces of advice I highly recommend you follow while trading:
✅ Do Not Add to a Losing Position
- While this is just common sense, ignorance of the principle, or carelessness in its employment has caused disasters to many traders in the course of history. Nobody knows where a currency pair will be heading during the next few hours, days, or even weeks. There are lots of educated guesses, but no knowledge of where the price will be a short while later.
- The only certain value about trading is now. Nothing much can be said about the future. Consequently, there can be no point in adding to a losing position, unless you love gambling. A position in the red can be allowed to survive on its own in accordance with the initial plan, but adding to it can never be an advisable practice.
✅ Don’t Let Emotions Come Into Play
- Greed, excitement, euphoria, panic or fear should have no place in traders’ calculations. Yet traders are human beings, so it is obvious that we have to find a way of living with these emotions, while at the same time controlling them and minimizing their effect on our lives. That is why traders are always advised to begin with small amounts.
- By reducing our risk, we can be calm enough to realize our long term goals, reducing the impact of emotions on our trading choices. A logical approach, and less emotional intensity are the best forex trading tips necessary to a successful career.
✅ Study Your Success & Failure
- An analytical approach to trading does not begin at the fundamental and technical analysis of price trends, or the formulation of trading strategies. It begins at the first step taken into the career, with the first dollar placed in an open position, and the first mistakes in calculation and trading methods.
- The successful trader will keep a diary, a journal of his trading activity where he carefully scrutinizes his mistakes and successes to find out what works and what does not. This is one of the most importance forex trading tips that you will get from a good mentor.
Thank you for all the love you gave on my previous post, I’ll be dropping some more value bombs soon! 💸🚀
Labels: Forex, Investment Quote
08 October 2018
Forex is NOT EASY. Don’t give up!
By Brad Mitchell
Forex is NOT EASY. Don’t give up!
Success takes a lot of time, dedication, and most importantly: Action. Without taking massive action you literally have ZERO chance of building a long-term source of income with anything. Period.
I started trading Forex in 2016 and it definitely wasn’t easy. I went through countless nights of studying the market, analyzing patterns, testing different techniques, and much more.
Every time I wanted to throw in the towel I always reminded myself why the heck I’m still doing this, and that’s solely for financial freedom. After all the trial and error, the ups and downs, I finally figured out what worked.
I know a lot of you are feeling frustrated and/or confused because there’s so much to learn, so here are some VALUABLE KEYS that helped me a TON:
✅ Be Consistent & Correct Before You Start Worrying About Money
- A lot of people start off with the mindset where they think to themselves; “If I catch this many pips I’ll make X amount of money!” Slow your role, you’re thinking about money WAY too soon if you haven’t even learned how to trade or analyze yet. Make sure you fully understand how the market moves before you start to think about how much profit you’re going to make off each move.
- At the end of the day, if you’re prematurely thinking about the money, you’re going to over leverage and end up putting too much volume on each trade which will eventually blow your account. Even though making money is the ultimate goal in Forex, learning how to accurately predict the market is the most important part in order to succeed.
✅ Trade Higher Timeframes
- It makes no sense as to why anybody, especially if you’re new, would trade small 5 minute timeframes. I recommend to learn and trade higher timeframes in order to see the bigger picture, rather than being zoomed into one specific period of time. This will ultimately result in better long-term trading success. Pretty self explanatory.
✅ Focus on 1-2 Pairs at a Time
- Each pair has it’s own story, they move differently and at different times. Many people waste their time focusing on multiple pairs at once such as gold, commodities, etc. Instead, you need to learn and master 1-2 pairs at a time before moving onto the next pair. How do you expect to master pairs if you’re trading so many at once and constantly switching between them? If you’re not consistent with just 1, how do you expect to be consistent with 5-10? My point exactly. Forex isn’t a game, it’s not something you can play around with and expect to learn overnight.
I hope this helped some of you guys out who are trading in the foreign exchange markets. If you have any questions feel free to drop a comment or reach out to me. I’d be more than happy to help!
If you guys like these types of posts, I can definitely drop some value in this group more often.
Labels: Forex, Investment Quote
21 September 2018
High Probability Trading Strategy — A Complete Guide
Credit: Rayner Teo
Do you want to find high probability trading setups?
I’m sure you do, right? (Or you won’t be reading this right now)
But the thing is…
…you’re not sure how.
Instead of looking at price, you’re looking at indicators (without understanding the purpose of it).
Instead of following trends, you’re trying to predict market reversals.
Instead of proper risk management, you put on a huge bet because this trade “feels good”.
Now…
If you’re doing any of the above, then it will be difficult to identify high probability trading setups.
But don’t worry.
I’ve got good news for you.
Because in this post, I’ll teach you step-by-step on how to find high probability trading setups.
Here’s what you’ll learn:
Why trading with the trend increase your returns and reduce your risk
How to identify the best areas to trade on your chart
How to trade pullback, breakouts, and the failure test pattern
How to set a proper trading stop loss so you don’t get stopped out “too early”
A high probability trading strategy that lets you profit in bull & bear markets
Are you ready?
Then let’s begin…
Secret Bonus:
Get my free training video where you’ll learn how to identify high probability trading setups (include trading techniques that you can use to profit in the markets immediately)
The trend gives you the biggest bang for your buck
The definition of the trend is this…
Uptrend – consists of higher highs and lows
Downtrend – consists of lower highs and lows
If you want to know where’s the path of least resistance, look left (and follow the trend).
When the price is in an uptrend, you should stay long. When the price is in a downtrend, you should stay short.
By trading with the trend, you can see that the impulse move (green) goes much more in your favor, compared to the corrective move (red).
Here are a couple of examples…
most bang for buck 2most bang
Now you’re probably wondering:
Rayner, identifying a trend looks easy. But how do I enter an existing trend?
And this is what we’re covering next…
Trade in the direction of the general market. If it’s rising you should be long, if it’s falling you should be short. – Jesse Livermore
How to identify areas of value on your chart
You’d probably heard of the saying, “buy low sell high”.
But the question nobody asks is…
…what’s low and what’s high, right?
This is where Support & Resistance comes into the picture.
Support & Resistance
And this is the definition of it:
Support – an area with potential buying pressure to push price higher (area of value in an uptrend)
Resistance – an area with potential selling pressure to push price lower (area of value in a downtrend)
Here’s what I mean…
support in uptrendresistance in downtrend
Dynamic Support & Resistance
What you’ve seen earlier is what I call, classical Support & Resistance (horizontal lines)
Alternatively, it can come in the form of moving average. This is known as dynamic Support & Resistance (and I use the 20 & 50 EMA).
This is what I mean…
dynamic support2dynamic resistance2
Not only does support & resistance allows you to trade from an area of value, it improves your risk to reward and winning rate as well.
Watch this training video below and learn how:
Now, another “trick” you can use is to use overbought/oversold indicators.
High probability trading — using Stochastic to identify areas of value
A big mistake most traders make is, going short just because the price is overbought, or oversold.
Because in a strong trending market, the market can be overbought/oversold for a sustained period of time (and if you’re trading without stops, you risk losing your entire account).
Here’s what I mean:
oversold for long periodoverbought for long period
Now you’re wondering:
How do I use Stochastic to identify areas of value?
Here’s the secret…
Are you ready?
In an uptrend, you only look for longs, when the price is oversold.
In a downtrend, you only look for shorts, when the price is overbought.
Here’re some examples:
oversold in uptrendoverbought in downtrend
If you follow this simple rule, you can “predict” when a pullback will usually end.
So, you’ve learned how to identify areas of value on your chart.
Now…
…you’ll learn how to better time your entries.
How to enter your trades
There’re 3 ways you can enter a trade:
Pullback
Breakout
Failure test
Pullback
A pullback is when price temporarily moves against the underlying trend.
In an uptrend, a pullback would be a move a lower.
Here’s an example:
pullbacks in uptrend
And…
In a downtrend, a pullback would be a move higher.
An example:
pullbacks in downtrend
According to the work’s of Adam Grimes, trading pullbacks has a statistical edge in the markets as proven here.
You may wonder:
What are the pros and cons of trading pullbacks?
Advantages of trading pullbacks:
You get a good trade location as you’re buying into an area of value. This gives you a better risk to reward profile.
Disadvantages of trading pullbacks:
You may potentially miss a move if the price doesn’t come into your identified area.
You’ll be trading against the underlying momentum.
Breakout
A breakout is when price moves outside of a defined boundary.
The boundary can be defined using classical support & resistance.
Breakout to the upside:
upside breakout
Breakout to the downside:
downside breakout
You’re wondering:
What are the pros and cons of trading breakouts?
Advantages of trading breakouts:
You will always capture the move.
You are trading with the underlying momentum.
Disadvantages of trading breakouts:
You get a poor trade location as you’re paying a premium.
You may encounter a lot of false breakouts.
For a more in-depth explanation, go read The Definitive Guide to Trading Pullbacks and Breakouts.
Failure test
This technique possibly originated from Victor Sperandeo, and the works of Adam Grimes shows that it has a statistical edge in the markets.
It works like this…
You’re entering your trade when the price does a false breakout of Support/Resistance. Thus taking advantage of traders who are trapped from trading the breakout.
This entry can be applied in a trending or range market.
Here’re a few examples:
failure test2failure test3failure test1
For further explanation, watch this training video below:
Now, the next thing you’re going to learn is…
How to set your stop loss
Place your stops at a point that, if reached, will reasonably indicate that the trade is wrong, not at a point determined by the maximum dollar amount you are willing to lose. – Bruce Kovner
I’m going to share with you 3 ways to do it:
Volatility stop
Time stop
Structure stop
Volatility stop
A volatility stop takes into account the volatility of the market.
An indicator that measure volatility is the Average True Range (ATR), which can help set your stop loss.
You need to identify the current ATR value and multiply it by a factor of your choice. 2ATR, 3ATR, 4ATR etc.
atr
In the example above, the ATR is 71 pips.
So if you were to place a stop loss of 2ATR, take 2*71 = 142 pips
Your stop loss is 142 pips from your entry.
Pros:
Your stop loss is based on the volatility of the market
An objective way to define how much “buffer” you need from your entry
Cons:
It’s a lagging indicator because it is based on past prices
Time stop
A time stop determines when you exit your trades based on time.
Instead of exiting your trades based on price, you exit your trades after X amount of time has passed.
You need to define how much time you will allow before exiting it.
An example:
You took a short trade at resistance area. But after 5 days it’s not going anywhere, so you exit your trade.
time3
Pros:
You reduce losses
If you have trading records, you can identify optimal amount of time to give your trades
Cons:
You may exit prematurely only to see price move in your favor
Structure stop
A structure stop takes into account the structure of the market and set your stop loss accordingly.
An example…
Support is an area where price may potentially trade higher from. In other words, it’s a “barrier” that prevents further price decline.
Thus, it makes sense to have your stop loss below Support. Vice versa for Resistance.
Here’s what I mean:
sl below supportsl above resistance
You want to place your stop loss where there is a structure in the market that can act as a “barrier” for you.
Below is a training video that explains this concept in more detail…
Pros:
You know exactly when you’re wrong because market structure has broken
You’re using “barriers” in the market to prevent price from hitting your stops
Cons:
You need wider stop loss if the structure of the market is large (this results in smaller position size to keep your risk constant)
If you want to learn more, go read 13 ways to set your stop loss to reduce risk and maximise profits.
Now, let’s move on…
What is confluence and how it impacts your trading
Here’s the thing:
You’re not going to enter a long trade just because Stochastic is oversold, or the market is in an uptrend.
You’d need additional “supporting evidence” to give you the signal, to enter the trade. And this “supporting evidence” is known as, confluence.
Confluence is when two or more factors give the same trading signal. E.g. The market is in an uptrend, and price retraces to an area of support.
Here’re two guidelines for you:
1. Not more than four confluence factors
The more confluence you have, the higher the probability of your trade working out. But…
In the real world, your trading strategy should have anywhere between 2 – 4 confluence factors.
Anything more, chances are you’re going to get very little trading setups. And it’ll take you forever before your edge can play out.
You can take mediocre trading setups, and still make money in the long run.
2. Do not have more than one confluence factor in the same category
If you’re going to use indicators (oscillators) to identify overbought/oversold areas, then use that only.
Don’t add Stochastic, RSI and CCI because it’ll leave you with analysis paralysis. Similarly…
…adding simple, exponential and weighted moving average on your charts, doesn’t make any sense.
If you’re still reading at the point, you’re in for a treat. Because here comes the exciting part…
A high probability trading strategy that lets you profit in bull & bear markets
And here’s my secret (which is what you’ve just learned)…
Trade with the trend
Trade at areas of value
Find an entry
Set my stop loss
Plan my exit
If a trade meets these 5 criteria, then its a good trade to me.
Now, let’s learn a new trading strategy, that gives you high probability trading setups.
Are you ready?
Here it goes…
If 200ma is pointing higher and the price is above it, then it’s an uptrend (trading with the trend).
If it’s an uptrend, then wait for the price to pullback to an area of support (trading at an area of value).
If price pullback to an area of support, then wait for failure test entry (my entry trigger).
If there’s failure test entry, then go long on next candle’s open (my entry trigger).
If a trade is entered, then place a stop loss below the low of the candle, and take profit at nearest swing high (my exit and profit target).
Vice versa for a downtrend
**Disclaimer: I will not be responsible for any profit or loss resulting from using this trading strategy. Past performance is not an indication of future performance. Please do your own due diligence before risking your hard earned money.
Here’re a few trading examples:
high probability trading setup3high probability trading setup2high probability trading setup1
Secret Bonus:
Get my free training video where you’ll learn how to identify high probability trading setups (include trading techniques that you can use to profit in the markets immediately)
Here’s the thing:
You may not be comfortable using my trading strategy because it may not suit you.
So, what you need to do is, “tweak” it into something that fits you. And this is what we’ll cover next…
I don’t think traders can follow rules for very long unless they reflect their own trading style. – Ed Seykota
How to develop a high probability trading strategy (a template you can use)
You can “mix and match” different trading techniques I’ve shared with you earlier.
But ultimately, your trading strategy needs to answer these 7 questions:
1. How are you going to define a trend?
You can consider moving average, trendline, structure etc.
2. How are you going to define an area of value?
You can consider dynamic Support & Resistance, weekly highs/lows, Stochastic etc.
3. How are you going to enter your trade?
You can consider pullbacks, breakouts, failure test, moving average crossover etc.
4. How are you going to exit your trade?
There’re many ways to exit a trade. Go read 13 Ways to Set Your Stop Loss to Reduce Risk and Maximise Profits to learn more.
5. How much are you going to risk on each trade?
I would suggest risking no more than 1% of your account on each trade, to avoid the risk of ruin.
6. How are you going to manage your trade?
Will you scale out or scale in your trades? If so, how much?
7. Which markets will you be trading?
Are you focusing on one market or many markets?
If you trade a variety of markets, you want to be aware of the correlation between markets.
Labels: Forex, Investment Quote, Reference, Risk Management, Stock Trading System
20 September 2018
10 Best Trading Tips You Can Learn in 10 Minutes That Improves Your Trading
Credit: Rayner Teo
Have you heard of the “Pareto principle”?
It’s known as the 80-20 rule, where 80% of the results is due to 20% of the effort.
So, what does this mean?
For a business, 20% of its clients produce 80% of its revenue.
For a software, 20% of its features cause 80% of its usage.
And for a trader, 20% of your actions produce 80% of your results.
Now… there are so many things a trader can focus on. Entries, exits, risk management, position sizing, fundamentals etc.
But the question is…
Which are the 20% that you must focus on, to deliver the biggest results?
So, this is what you’ll be learning today…
The 10 best forex trading tips that you can learn in 10 minutes, that will improve your trading immediately.
Are you ready?
Then let’s begin.
10 trading tips
Best forex trading tips #1: Don’t scare yourself out of a trade by going into lower time frames
Look:
If you enter a trade on the daily time frame, then manage that trade on the daily time frame.
A big mistake you can do is, drilling down into a lower time frame, and scare yourself out of the trade.
Here’s what I mean…
micro manage1micro manage2micro manage3
The takeaway is this…
If you enter off the daily time frame, you set your stop loss and manage your trade on the daily time frame.
If you enter off the 1-hour time frame, you set your stop loss and manage your trade on the 1-hour time frame.
If you enter off the 15 minutes time frame, you set your stop loss and manage your trade on the 15 minutes time frame.
Get it?
2. Place your stop loss at a level where your trading setup is invalidated
Don’t set your stop loss based on a dollar amount you’re willing to lose.
Instead…
Set it based on the structure of the markets, where if your stop loss is triggered, you know you’re wrong.
For example, if you’re long at support, then a break of support would mean you’re wrong…
support
Or if you’re trading a breakout, then a close back into the range would mean you’re wrong…
breakout
If you want more examples… go watch this training video below:
3. Trading with the trend increases the probability of your trades
When the market is trending, it has an ebb and flow with two different “legs” in it.
Impulse move – Longer “leg” that trades in the direction of the trend
Corrective move – Shorter “leg” that trades against the direction of the trend
By trading with the trend, you’ll get a bigger bang for your buck as the impulse move is stronger than the corrective move. This gives you greater profitability for the same amount of risk.
Here’s what I mean:
most-bangmost-bang-for-buck-2
The trend is your friend… right?
4. You need to find a trading method that suits you
If you love watching the markets and have all the time in the world, then a long-term trend following approach will not suit you. You’d micromanage your trades on the shorter time frames, and miss the longer term trend.
Or…
If you have a full-time job and can’t afford to watch the markets, then intraday trading will not suit you. You’d miss trading opportunities because you do not focus on the trading session.
Or…
If you love to build systematic trading systems, then learning how to read chart patterns and price action will not suit you. You’d be frustrated because there are some things in the market that can’t be quantified.
So whats my point?
My point is… you need to find a trading approach that suits you, yourself.
Here’s how you can increase the odds of your success:
Adopt a trading method that fits your belief about the markets (if you don’t believe in trends, then trying to be a trend follower is ridiculous)
Find a trading time frame that suits your schedule (if you have little time to trade, stick to the higher time frames)
Don’t hop from one trading system to the next, just because you see another trader having success with it (that’s a sure fire way to remain a consistently inconsistent trader)
5. Don’t abandon your trading strategy after a few losing trades
Why?
Because no matter how good a trading strategy is, in the short run your results are random.
And this can be explained using the law of large number…
If you take a coin and toss it 1000 times, you’d get close to 50% heads and 50% tails.
However, if you toss it 10 times only, it’s unlikely to be 50% heads and 50% tails due to the small sample size.
And its the same in trading…
You cannot conclude a trading strategy doesn’t work based on a small sample size because, in the short run, your results are random.
Instead… you need a minimum of 100 trades to find out whether your trading strategy has an edge in the markets.
6. A trading plan makes you a more disciplined trader
One of the biggest reasons why you fail as a trader is because you don’t have a trading plan.
You’re trading decisions based on your emotions, subjectivity, and opinions of the market.
Getting into trades because:
Of an “insider tip” you heard from a friend
You think price can’t go any lower
You’re bored
And here’s the thing…
If you have an inconsistent set of actions, how do you expect to have a consistent set of results?
Here’s the thing:
The only way you’re going to achieve consistent trading performance is by having a consistent set of actions, and this can be achieved by following your trading plan.
If you want to learn how to develop your trading plan, read this post here.
7. Risk 1% on each trade to prevent your own destruction
Imagine:
You have a trading system that wins 50% of the time with 1:2 risk reward.
And you have a hypothetical outcome of L L L L W W W W
It’s a profitable system, right?
It depends.
If you risk 30% of your equity, you’d blow up by the 4th trade (-30 -30 -30 -30 = -120%)
But…
If you risk 1% of your equity, you’d have a gain of 4% (-1 -1 -1 -1 +2 +2 +2 +2 = 4%)
Having a winning system without proper risk management isn’t going to get you anywhere.
You need a winning system with proper risk management.
And not forgetting…
The recovery from the risk of ruin is not linear, it could be impossible to recover if it goes too deep.
risk of ruin
If you lose 50% of your capital, you need to make back 100% to break even.
Yes, you read right. 100%, not 50%.
That’s why you always want to risk a fraction of your equity, especially when your winning ratio is less than 50%.
So, how much should you risk exactly?
This depends on your winning ratio, the risk to reward, and your risk tolerance. I would advise risking no more than 1% per trade.
8. You don’t need to know everything to be a profitable trader
Why do I say that?
Because I made the mistake of thinking I needed to know everything, in order to make money from trading.
And my turning point was when I realized that, less is more.
Simplicity is the ultimate sophistication - Leonardo Da Vinci
CLICK TO TWEET
Now, I’m here to tell you this:
You don’t need to know any fundamentals of the market you’re trading
You don’t need to know what the big players are doing
You don’t need to know what is pivot point
You don’t need to know what is a Crab pattern
You don’t need 6 monitors to trade
You don’t need to purchase any proprietary software, tools or indicators
And you can still be a consistently profitable trader.
Now you’re probably wondering:
So, what do I need?
A trading strategy that has an “edge”
Proper risk management
The right trading psychology
Go watch this training video below as I’ll explain further:
9. Keep a trading journal if you’re serious about trading
Do you recall the past trades you’ve taken?
Perhaps there’s a chart pattern that is showing a high probability of success.
Perhaps your trading strategy that isn’t working well in current market conditions.
Perhaps you’re not following your trading plan which is causing your performance to deteriorate.
Now, if you don’t have a trading journal…
How do you know what you’re doing wrong?
How do you know what you’re doing right?
How do you know what can you improve on?
Get my point?
So, if you’re serious about trading, you must have a trading journal. And you can learn how to create one here.
10. One “trick” to improve the returns of your trading performance
No, it’s not adding another “filter”.
No, it’s not adjusting the parameters of your indicator.
Its… knowing when to stay out of the markets.
Here’s an example:
Let’s assume a trend following strategy would make 20% in a trending market, and lose 15% in a range market.
In a given year, the market was in a trend once, and in a range once. Thus netting a return of 5% (20 – 15).
Now, what if you can identify the range market, and stop trading during that period, would your returns improve?
You bet.
Instead of earning a return of 5%, you made 20% because you stopped trading when the markets weren’t favorable.
The takeaway is this…
You need to know when to stay long.
You need to know when to stay short.
And you need to know when to stay out.
Labels: Forex, Investment Quote, Stock Trading System
28 July 2018
Forex Bank Trading Strategy Revealed
by Sterling Suhr
Anyone successful in the forex market will hands down agree there is no greater career one could have. The ability to work your own schedule, the freedom, and income potential is hard to match with any other career. Having said that, what does it take to become successful in the forex market? Plain and simple we need the proper forex education to achieve success.
In a market with a success rate of 5% it is important that we search out and receive forex training that will allow us to be in that very small successful group of traders. How does one go about doing so? To put it simply if the forex trading strategy that is being used is one used by the masses, then how can one expect different results than the masses? 5% of retail traders succeed, which tells us that 95% fail and thus we have no other choice than to break free from the failing forex education system!
ENTER YOU ENEMIES HEAD AND THINK LIKE A BANK
Before we begin I would like to give a preface to the forex bank trading strategy. First, it is common knowledge that the banks drive the forex market. It is not a hidden fact that they drive the most amount of volume on a daily basis and as a result they drive short term moves. If we understand that the banks drive, manipulate, and push this market then wouldn’t it be hugely beneficial to track when they are entering and what position they are taking? This is the very foundation of the bank day trading strategy we employ. If we can decipher when they are entering, and what position they are taking then we do not need any further information to make a profitable forex trading decision.
We must remember that this is the banks market, and not ours! Retail traders are simply figurative flies on the wall. Keeping that in mind, why then do most retail forex traders out there attempt to invent or learn forex trading strategies that have been created to try and fit a market we do not control? It is our strong conviction at Day Trading Forex Live that success in the forex market is only possible when we stop trying to fit forex strategies to a market we don’t control, but rather learn the trading strategy of the banks! This is their business, and they have a business model (aka forex trading strategy) that we must learn to follow to achieve consistent results! Every day the banks repeat the same 3 step process. If we learn to trade forex by following their model we will have a much greater chance of success…after all the banks are the ones moving the market.
3 STEPS TO SUCCESS
As we just mentioned the banks use a 3 step process day after day to profit from the forex market. We can think of this process as their forex trading strategy. It has rules that they follow, it is repeatable, and it consistently results in profit. In any market there must be a counter party to every transaction. If you are looking to buy the market someone must be willing to sell to you, and conversely if you are looking to sell the market then someone needs to be willing to buy it from you. This is the basis for how the market at its foundation works and therefore this is how we track how the banks trade.
Accumulation: As discussed above there is a counter party to every transaction in any market including the forex market. Therefore when a bank or group of banks desires to enter the forex market they must do so by accumulating a position over time. Unlike you and I, because of the sheer volume banks push they must enter positions during times most people would term as consolidation or range bound markets.
These periods of consolidation are what we call accumulation as they are areas where smart money (banks, hedge funds, ect) enters or accumulates their desired position over the course of time. By doing this through tight range bound periods banks are able to not only keep what they are accumulating secret to the rest of the market, but they are also able to get a much better overall entry price. This is the foundation to any trade made by the banks. Money is made by accumulating a long position they will later sell off at a higher price, or accumulating a short position they will later cover at a lower price.
This is one of the most essential keys to trading forex successfully, and yet it is always over looked or worse yet called consolidation which is viewed as useless times in the market that mean nothing. Our single goal should be to track when the banks are entering the market and what position they are entering and thus these areas of accumulation are critical to our trading decisions. As discussed above banks are the ones moving this market, and therefore if you can identify the position they are accumulating you can identify which direction the market will move next with a high degree of accuracy. What then comes after this period of accumulation?
Spotting Forex Market Manipulation
Manipulation: Over and over through my years of educating forex traders I’ve heard many forex traders say that it feels as if they are entering the market at exactly the wrong time. Many retail forex traders feel as if the market is just waiting for them to enter before it instantly turns the opposite direction. I’m here to tell you that it’s true! This is a critical idea that all must understand and come to accept. We all know the failure rate among traders, but what does this information tell us?
Remember above when we discussed that there must be a counter party to every trade? This is a well-known fact and it is indisputable. Because the mega banks position is so large they must essentially create their own market. For example lets say Bank X was looking to sell the EUR/USD. In order to sell the position size they desire there would have to be someone willing to buy an equal amount of the EUR/USD. This is where the retail forex trader comes in.
Forex traders are predictable. As a general rule of thumb all traders go through the same education, use the same trading strategies, and use the same software and indicators. While each strategy has its own small differences, the majority generate the same losing results and this is undeniable. If this weren’t true wouldn’t we see a success rate higher than 5%? Therefore while the strategies differ, the outcome and thus trades tend to be in large part the same which explains why the outcome of retail traders tends to be the same. Because of this the banks are well aware of how to get retail traders to enter the market.
Going back to our illustration if Bank X was looking to sell the EUR/USD then they would push the price up, which it turn would begin to trigger buying pressure from retail traders. At this same point they would begin to sell into all that buying pressure, and then the market instantly turns to the downside. This is the central reason many retail forex traders consistently enter the market at exactly the wrong time. The unfortunate part about this is the fact that this information is actually the most powerful thing the banks give us, but only if we open our eyes to it. The manipulation of price tells us what position they have been accumulating and thus tells us the direction they intend to drive the price. I urge you to look back at all large market moves. Before most every move in the forex market you will see a tight range bound period that is accumulation followed by a false push in the opposite direction of the trend.
Learn To Day Trade Stop Run Reversals
Distribution/Market Trend: After they have accumulated a position through the standard tight ranging market, banks will often create a false push that we just discussed which is manipulation. This false push is an extension of the accumulation period as it allows them to finish entering the rest of the position they had been accumulating. This as we just discussed is the reason so many forex traders enter the market at exactly the wrong time. If however we know the tricks they use we can avoid being a pawn of the banks manipulation, and instead profit from it as they do!
If we have correctly identified which direction they have manipulated the market we can then understand which direction they intend to push the price. This is called the distribution phase of the market, and is seen visually as a market trend. Again this market trend comes only after the banks have finished accumulating their position through tight range bound price action as well as manipulation. Hands down this is the easiest area for us to profit from but only if we can properly identify the first 2 steps in the process. Through this article I have marked out this 3 step process on a series of charts. New concepts can be hard to understand with only words and therefore I believe the charts should serve you well in the learning process. As you examine these charts you should be identifying the 3 stages of the bank day trading strategy.
PUTTING FOREX IN PERSPECTIVE
Bottom line is this forex trading strategy is no doubt very different than what you have heard before. Realizing the chart is a false manipulation of prices and learning to read the intention behind the moves will take practice. Anything in life that is new takes time to learn and this will be no exception. However, the potential reward of being a profitable forex trader is massive and in our opinion unmatched! Having the freedom to do as you like, and the money to support that freedom is something forex trading offers to all of us, but only if we are willing to work for it. Everyone reading this knows most traders fail. Everyone reading this knows the general ways most trade. Therefore if you are using a forex trading strategy used by the masses I strongly urge you to give some serious thought as to why you feel the outcome will be different for you? At some point we all need to realize that maybe it’s not the tens of thousands of retail forex traders that are failing, but rather maybe it’s the strategies that are flawed to begin with. Therefore I again urge you to take in this free information, give it some thought, and apply it in your trading! I say this not to offend anyone but rather in a sincere effort to get everyone reading this thinking about the facts. Either way I sincerely wish you all the best and I truly hope I can serve you in your progression as a forex trader.


Forex Charts Patterns – Do They Increase Your Edge?
October 21
06:08
2011
by Sterling Suhr
3 Comments
Forex chart patterns (increase your edge) Every one trading forex chart patterns knows that they have the potential to increase your edge. Every different chart pattern including triangles, bull and bear flags, Gartley patterns or any other common pattern, all have a certain percentage of successful trade setups. Depending on your money management even a pattern that has a mere 50-50 outcome (most have better ratios) can still keep you in consistent profits, and I’m not going to argue that fact.
My argument
Just the other day I got into an argument with a good friend of mine when I told him that chart patterns are fake. I probably used the wrong words in our discussion because he got pretty angry. He took it as though I was telling him that the method he uses to trade is wrong and that wasn’t my intention. I was merely pointing out that the chart patterns we see on the charts are not true patterns. Even though they repeat and have a certain percentage of likely outcome over time, the percentage of successful setups changes over time.
Consider this, in order for any pattern on a chart to be true you would need the same traders, thinking the same thing, taking the same trades, with the same fundamental outlook, that created the first pattern, and all this would need to happen at the same time with the same amount of money used on each trade. This is literally impossible. So he tells me “well the charts are dynamic” and I said “exactly”! What I can tell you with certainty is that those chart patterns follow thru in the direction that Smart Money wants them to, and not because there is any consistency to any certain outcome of the pattern. Now that begs the question of what has happened when the pattern does not do what it should do?
The short answer is you have been manipulated by the smart money to believe that the pattern will have a certain outcome when the whole time they have been accumulating a position against the most likely outcome of that particular pattern. Remember for every buyer there is a seller and for every seller there is a buyer. Therefore Smart Money knows that if for example they create what visually looks like an upward triangle on the chart, retail forex traders will begin to buy. As retail traders begin to buy smart money is the one selling it to them. Those traders are trapped in a long position and served the purpose of buying smart money’s desired short position.
The deception
We all know that trading is essentially gambling. We are taking a bet that price will move our direction, and it’s as simple as that. What separates the trading environment from the casino environment is our edge as traders. When we use our edge we are actually placing our self in the casinos position rather than the gambler that pulls the slot handle. The slot machine is designed to suck you in to believing you can win even though the odds are extremely against you. This is exactly what Smart Money does with these so called predictable patterns. Giving you small wins over time creates the thought process that you are using a winning strategy, and the next big hit is only one trade away!
They also use the moving averages and any other standard indicator commonly used by retail traders. The fact is they know how traders use them and can move price enough to make the pattern break or MAs cross just to suck us into the market. It is absolutely essential that Smart Money does this as they literally have to create buyers if they would like to sell the market, and they must create sellers if they are looking to buy the market. The shorter the time frame the easier it is for them to trap traders. This is our personal belief and we ask you to do some serious thinking on this matter, as it could mean your ultimate success or failure in the forex market.
The Smart Money
When referring to the Smart Money we are essentially talking about the worlds ten largest banks. They are (in order) BNB Parabas, Royal bank of Scotland, Barclays, Deutsche Bank, HSBC Bank, Credit Agricole, Bank of America, Mitsubishi UFJ, JP Morgan Chase, and UBS AG. They also include Investment banks such as Goldman Sachs and the like. Even your typical large bucket shop broker that is not a registered ECN such as FXCM fits the bill. The reason we call these guys the Smart Money is the fact that they have access to information we as retail traders will never have.
I have recently read many articles detailing how these guys get insider information from sources within our own governments. To think that they wouldn’t manipulate the intraday market is naive at best. Here is a great video where well known trader Jim Cramer blew the whistle when he admitted to manipulating stock prices during his days as a hedge fund manager, and went on to say not only how easy it was, but also that everyone is doing it. Again it would be naive to think that it is different for the currency market. Why would it be? If you had access to order flow and inside information from government sources to trade from would you? Of course you would! I know I would!
The points and facts in this article are just some of the ways they manipulate free markets. It would take a book to describe them all. Below however is a nice example. This is a chart of Non-Farm Payroll from December 2nd, 2011. First notice the ascending that at first
broke thru the pattern as expected before the release. It then tests the breakout level and rises during London session not only taking out stops but sucking in new buyers as the pattern has worked and traders buy. This was a manipulation by the London market as they accumulated sell orders. A couple hours later the NFP numbers came out and was lower than expected, but the unemployment rate was much better than expected as you can see on the chart. It doesn’t take much for math skills to figure that a fall in the unemployment rate couldn’t be caused by a lower number of jobs added in a month. Even I knew that the drop in unemployment was due to people either running to the end of their unemployment benefits or giving up on looking for work entirely (the Smart Money knows this better than I do) yet you can see how price spiked up to take out stops above the highs before the drop. Who do you think did that?
These are 2 classic examples of how the Smart money uses patterns and news to manipulate traders into bad positions in order them to be able to enter their desired position. Again, and at the risk of sounding like a broken record there has to be someone willing to buy if you are looking to sell, and someone looking to sell if you are looking to buy. This is a problem for Smart Money given the size of the positions they enter, and it is ABSOLUTELY necessary for them to manipulate the market into the opposite of their intended direction. We must use this information if we are to avoid being part of the losing heard of retail traders.
Increase your edge
Now I am sure you are wondering how then do you increase your edge? The short answer is instead of trading a manipulated pattern trade with the Smart Money. There are certain things the Smart money does to “show their hand” so to speak. For Example:
Market intent – A substantial increase in volume, with the bar opening on its high and closing on its low, or opening on its low and closing on its high.
Faded moves – A lower volume move often against the trend showing little or no interest in the direction of the reversal. This can also be a series of lower volume bars that slowly move against the trend.
Sudden shifts A shift in direction opposite the short term direction of the last several bars. This often comes after a faded move. Example: Assume the trend is down and you then have 3 low volume candles up followed by the next candle aggressively jumping down. This is a sudden shift from a market moving slowly up to aggressively down.
Stop runs – A pop above or below a short term high or low that gets rejected usually forming a large wick on the bar. This is usually the clearest way to identify what Smart Money is doing, and the position they are accumulating. Those new to tracking Smart Money should at first stick with stop runs as they are the easiest to identify. What we are determining using these is how they are manipulating the market. Eventually the Smart Money has to create the move in the direction they will profit from and these are the ways they show it to us before the trend actually begins.
Before you conclude that I am speaking about another pattern let me tell you that there is no consistent pattern to follow here and that is NOT what we are looking for. We only need to see a few of these tell tale signs of what they are doing. Smart Money is very secretive in what position they are accumulating but they can’t hide it forever. Imagine if Smart Money was like a terrible poker player that had a sure “tell” that gave away what they were accumulating every time. If this was the case we would all begin to pile on before they finished accumulating their desired position! This would essentially ruin the way they trade, and therefore this is why they do everything they can to disguise what position they are entering.
What I do is look for the tell tale signs and only trade when I’m certain of the direction the Smart Money has been accumulating. Are we right 100% of the time? No, but when I see the chart patterns I can use the Forex Bank Trading Strategy and increase my edge once the manipulation becomes clear.

Anyone successful in the forex market will hands down agree there is no greater career one could have. The ability to work your own schedule, the freedom, and income potential is hard to match with any other career. Having said that, what does it take to become successful in the forex market? Plain and simple we need the proper forex education to achieve success.
In a market with a success rate of 5% it is important that we search out and receive forex training that will allow us to be in that very small successful group of traders. How does one go about doing so? To put it simply if the forex trading strategy that is being used is one used by the masses, then how can one expect different results than the masses? 5% of retail traders succeed, which tells us that 95% fail and thus we have no other choice than to break free from the failing forex education system!
ENTER YOU ENEMIES HEAD AND THINK LIKE A BANK
Before we begin I would like to give a preface to the forex bank trading strategy. First, it is common knowledge that the banks drive the forex market. It is not a hidden fact that they drive the most amount of volume on a daily basis and as a result they drive short term moves. If we understand that the banks drive, manipulate, and push this market then wouldn’t it be hugely beneficial to track when they are entering and what position they are taking? This is the very foundation of the bank day trading strategy we employ. If we can decipher when they are entering, and what position they are taking then we do not need any further information to make a profitable forex trading decision.
We must remember that this is the banks market, and not ours! Retail traders are simply figurative flies on the wall. Keeping that in mind, why then do most retail forex traders out there attempt to invent or learn forex trading strategies that have been created to try and fit a market we do not control? It is our strong conviction at Day Trading Forex Live that success in the forex market is only possible when we stop trying to fit forex strategies to a market we don’t control, but rather learn the trading strategy of the banks! This is their business, and they have a business model (aka forex trading strategy) that we must learn to follow to achieve consistent results! Every day the banks repeat the same 3 step process. If we learn to trade forex by following their model we will have a much greater chance of success…after all the banks are the ones moving the market.
3 STEPS TO SUCCESS
As we just mentioned the banks use a 3 step process day after day to profit from the forex market. We can think of this process as their forex trading strategy. It has rules that they follow, it is repeatable, and it consistently results in profit. In any market there must be a counter party to every transaction. If you are looking to buy the market someone must be willing to sell to you, and conversely if you are looking to sell the market then someone needs to be willing to buy it from you. This is the basis for how the market at its foundation works and therefore this is how we track how the banks trade.
Accumulation: As discussed above there is a counter party to every transaction in any market including the forex market. Therefore when a bank or group of banks desires to enter the forex market they must do so by accumulating a position over time. Unlike you and I, because of the sheer volume banks push they must enter positions during times most people would term as consolidation or range bound markets.
These periods of consolidation are what we call accumulation as they are areas where smart money (banks, hedge funds, ect) enters or accumulates their desired position over the course of time. By doing this through tight range bound periods banks are able to not only keep what they are accumulating secret to the rest of the market, but they are also able to get a much better overall entry price. This is the foundation to any trade made by the banks. Money is made by accumulating a long position they will later sell off at a higher price, or accumulating a short position they will later cover at a lower price.
This is one of the most essential keys to trading forex successfully, and yet it is always over looked or worse yet called consolidation which is viewed as useless times in the market that mean nothing. Our single goal should be to track when the banks are entering the market and what position they are entering and thus these areas of accumulation are critical to our trading decisions. As discussed above banks are the ones moving this market, and therefore if you can identify the position they are accumulating you can identify which direction the market will move next with a high degree of accuracy. What then comes after this period of accumulation?
Spotting Forex Market Manipulation
Manipulation: Over and over through my years of educating forex traders I’ve heard many forex traders say that it feels as if they are entering the market at exactly the wrong time. Many retail forex traders feel as if the market is just waiting for them to enter before it instantly turns the opposite direction. I’m here to tell you that it’s true! This is a critical idea that all must understand and come to accept. We all know the failure rate among traders, but what does this information tell us?
Remember above when we discussed that there must be a counter party to every trade? This is a well-known fact and it is indisputable. Because the mega banks position is so large they must essentially create their own market. For example lets say Bank X was looking to sell the EUR/USD. In order to sell the position size they desire there would have to be someone willing to buy an equal amount of the EUR/USD. This is where the retail forex trader comes in.
Forex traders are predictable. As a general rule of thumb all traders go through the same education, use the same trading strategies, and use the same software and indicators. While each strategy has its own small differences, the majority generate the same losing results and this is undeniable. If this weren’t true wouldn’t we see a success rate higher than 5%? Therefore while the strategies differ, the outcome and thus trades tend to be in large part the same which explains why the outcome of retail traders tends to be the same. Because of this the banks are well aware of how to get retail traders to enter the market.
Going back to our illustration if Bank X was looking to sell the EUR/USD then they would push the price up, which it turn would begin to trigger buying pressure from retail traders. At this same point they would begin to sell into all that buying pressure, and then the market instantly turns to the downside. This is the central reason many retail forex traders consistently enter the market at exactly the wrong time. The unfortunate part about this is the fact that this information is actually the most powerful thing the banks give us, but only if we open our eyes to it. The manipulation of price tells us what position they have been accumulating and thus tells us the direction they intend to drive the price. I urge you to look back at all large market moves. Before most every move in the forex market you will see a tight range bound period that is accumulation followed by a false push in the opposite direction of the trend.
Learn To Day Trade Stop Run Reversals
Distribution/Market Trend: After they have accumulated a position through the standard tight ranging market, banks will often create a false push that we just discussed which is manipulation. This false push is an extension of the accumulation period as it allows them to finish entering the rest of the position they had been accumulating. This as we just discussed is the reason so many forex traders enter the market at exactly the wrong time. If however we know the tricks they use we can avoid being a pawn of the banks manipulation, and instead profit from it as they do!
If we have correctly identified which direction they have manipulated the market we can then understand which direction they intend to push the price. This is called the distribution phase of the market, and is seen visually as a market trend. Again this market trend comes only after the banks have finished accumulating their position through tight range bound price action as well as manipulation. Hands down this is the easiest area for us to profit from but only if we can properly identify the first 2 steps in the process. Through this article I have marked out this 3 step process on a series of charts. New concepts can be hard to understand with only words and therefore I believe the charts should serve you well in the learning process. As you examine these charts you should be identifying the 3 stages of the bank day trading strategy.
PUTTING FOREX IN PERSPECTIVE
Bottom line is this forex trading strategy is no doubt very different than what you have heard before. Realizing the chart is a false manipulation of prices and learning to read the intention behind the moves will take practice. Anything in life that is new takes time to learn and this will be no exception. However, the potential reward of being a profitable forex trader is massive and in our opinion unmatched! Having the freedom to do as you like, and the money to support that freedom is something forex trading offers to all of us, but only if we are willing to work for it. Everyone reading this knows most traders fail. Everyone reading this knows the general ways most trade. Therefore if you are using a forex trading strategy used by the masses I strongly urge you to give some serious thought as to why you feel the outcome will be different for you? At some point we all need to realize that maybe it’s not the tens of thousands of retail forex traders that are failing, but rather maybe it’s the strategies that are flawed to begin with. Therefore I again urge you to take in this free information, give it some thought, and apply it in your trading! I say this not to offend anyone but rather in a sincere effort to get everyone reading this thinking about the facts. Either way I sincerely wish you all the best and I truly hope I can serve you in your progression as a forex trader.


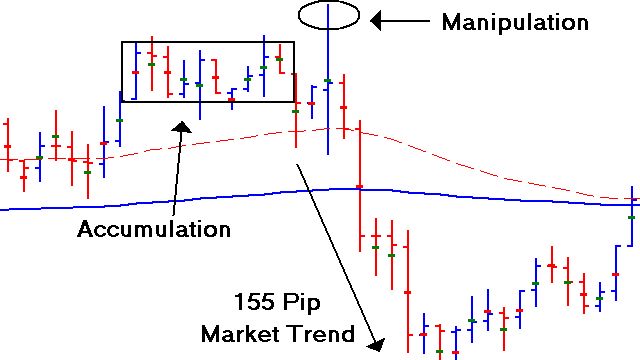

Forex Charts Patterns – Do They Increase Your Edge?
October 21
06:08
2011
by Sterling Suhr
3 Comments
Forex chart patterns (increase your edge) Every one trading forex chart patterns knows that they have the potential to increase your edge. Every different chart pattern including triangles, bull and bear flags, Gartley patterns or any other common pattern, all have a certain percentage of successful trade setups. Depending on your money management even a pattern that has a mere 50-50 outcome (most have better ratios) can still keep you in consistent profits, and I’m not going to argue that fact.
My argument
Just the other day I got into an argument with a good friend of mine when I told him that chart patterns are fake. I probably used the wrong words in our discussion because he got pretty angry. He took it as though I was telling him that the method he uses to trade is wrong and that wasn’t my intention. I was merely pointing out that the chart patterns we see on the charts are not true patterns. Even though they repeat and have a certain percentage of likely outcome over time, the percentage of successful setups changes over time.
Consider this, in order for any pattern on a chart to be true you would need the same traders, thinking the same thing, taking the same trades, with the same fundamental outlook, that created the first pattern, and all this would need to happen at the same time with the same amount of money used on each trade. This is literally impossible. So he tells me “well the charts are dynamic” and I said “exactly”! What I can tell you with certainty is that those chart patterns follow thru in the direction that Smart Money wants them to, and not because there is any consistency to any certain outcome of the pattern. Now that begs the question of what has happened when the pattern does not do what it should do?
The short answer is you have been manipulated by the smart money to believe that the pattern will have a certain outcome when the whole time they have been accumulating a position against the most likely outcome of that particular pattern. Remember for every buyer there is a seller and for every seller there is a buyer. Therefore Smart Money knows that if for example they create what visually looks like an upward triangle on the chart, retail forex traders will begin to buy. As retail traders begin to buy smart money is the one selling it to them. Those traders are trapped in a long position and served the purpose of buying smart money’s desired short position.
The deception
We all know that trading is essentially gambling. We are taking a bet that price will move our direction, and it’s as simple as that. What separates the trading environment from the casino environment is our edge as traders. When we use our edge we are actually placing our self in the casinos position rather than the gambler that pulls the slot handle. The slot machine is designed to suck you in to believing you can win even though the odds are extremely against you. This is exactly what Smart Money does with these so called predictable patterns. Giving you small wins over time creates the thought process that you are using a winning strategy, and the next big hit is only one trade away!
They also use the moving averages and any other standard indicator commonly used by retail traders. The fact is they know how traders use them and can move price enough to make the pattern break or MAs cross just to suck us into the market. It is absolutely essential that Smart Money does this as they literally have to create buyers if they would like to sell the market, and they must create sellers if they are looking to buy the market. The shorter the time frame the easier it is for them to trap traders. This is our personal belief and we ask you to do some serious thinking on this matter, as it could mean your ultimate success or failure in the forex market.
The Smart Money
When referring to the Smart Money we are essentially talking about the worlds ten largest banks. They are (in order) BNB Parabas, Royal bank of Scotland, Barclays, Deutsche Bank, HSBC Bank, Credit Agricole, Bank of America, Mitsubishi UFJ, JP Morgan Chase, and UBS AG. They also include Investment banks such as Goldman Sachs and the like. Even your typical large bucket shop broker that is not a registered ECN such as FXCM fits the bill. The reason we call these guys the Smart Money is the fact that they have access to information we as retail traders will never have.
I have recently read many articles detailing how these guys get insider information from sources within our own governments. To think that they wouldn’t manipulate the intraday market is naive at best. Here is a great video where well known trader Jim Cramer blew the whistle when he admitted to manipulating stock prices during his days as a hedge fund manager, and went on to say not only how easy it was, but also that everyone is doing it. Again it would be naive to think that it is different for the currency market. Why would it be? If you had access to order flow and inside information from government sources to trade from would you? Of course you would! I know I would!
The points and facts in this article are just some of the ways they manipulate free markets. It would take a book to describe them all. Below however is a nice example. This is a chart of Non-Farm Payroll from December 2nd, 2011. First notice the ascending that at first
broke thru the pattern as expected before the release. It then tests the breakout level and rises during London session not only taking out stops but sucking in new buyers as the pattern has worked and traders buy. This was a manipulation by the London market as they accumulated sell orders. A couple hours later the NFP numbers came out and was lower than expected, but the unemployment rate was much better than expected as you can see on the chart. It doesn’t take much for math skills to figure that a fall in the unemployment rate couldn’t be caused by a lower number of jobs added in a month. Even I knew that the drop in unemployment was due to people either running to the end of their unemployment benefits or giving up on looking for work entirely (the Smart Money knows this better than I do) yet you can see how price spiked up to take out stops above the highs before the drop. Who do you think did that?
These are 2 classic examples of how the Smart money uses patterns and news to manipulate traders into bad positions in order them to be able to enter their desired position. Again, and at the risk of sounding like a broken record there has to be someone willing to buy if you are looking to sell, and someone looking to sell if you are looking to buy. This is a problem for Smart Money given the size of the positions they enter, and it is ABSOLUTELY necessary for them to manipulate the market into the opposite of their intended direction. We must use this information if we are to avoid being part of the losing heard of retail traders.
Increase your edge
Now I am sure you are wondering how then do you increase your edge? The short answer is instead of trading a manipulated pattern trade with the Smart Money. There are certain things the Smart money does to “show their hand” so to speak. For Example:
Market intent – A substantial increase in volume, with the bar opening on its high and closing on its low, or opening on its low and closing on its high.
Faded moves – A lower volume move often against the trend showing little or no interest in the direction of the reversal. This can also be a series of lower volume bars that slowly move against the trend.
Sudden shifts A shift in direction opposite the short term direction of the last several bars. This often comes after a faded move. Example: Assume the trend is down and you then have 3 low volume candles up followed by the next candle aggressively jumping down. This is a sudden shift from a market moving slowly up to aggressively down.
Stop runs – A pop above or below a short term high or low that gets rejected usually forming a large wick on the bar. This is usually the clearest way to identify what Smart Money is doing, and the position they are accumulating. Those new to tracking Smart Money should at first stick with stop runs as they are the easiest to identify. What we are determining using these is how they are manipulating the market. Eventually the Smart Money has to create the move in the direction they will profit from and these are the ways they show it to us before the trend actually begins.
Before you conclude that I am speaking about another pattern let me tell you that there is no consistent pattern to follow here and that is NOT what we are looking for. We only need to see a few of these tell tale signs of what they are doing. Smart Money is very secretive in what position they are accumulating but they can’t hide it forever. Imagine if Smart Money was like a terrible poker player that had a sure “tell” that gave away what they were accumulating every time. If this was the case we would all begin to pile on before they finished accumulating their desired position! This would essentially ruin the way they trade, and therefore this is why they do everything they can to disguise what position they are entering.
What I do is look for the tell tale signs and only trade when I’m certain of the direction the Smart Money has been accumulating. Are we right 100% of the time? No, but when I see the chart patterns I can use the Forex Bank Trading Strategy and increase my edge once the manipulation becomes clear.

Labels: Forex
17 June 2018
Bank Traders Covert Tactics
16 June 2018
ALL YOU NEED TO LEARN TO TRADE FOREX
https://youtu.be/GljAqJhN3Yg?t=4003
Labels: Forex
Forex Trading Position Sizing & Money Management
https://youtu.be/tZqobytWXnI?t=1329
Labels: Forex
Identify Profitable Forex Trade Setups with Fibonacci
https://youtu.be/qVMa_u8_Xjs?t=1208
Labels: Forex
09 May 2014
EUR.USD
sell limit order filled at 1.39685 at 2.5 year high. Finally, I have successfully converted Euro to USD at high after long term patient waiting. Well done!
Labels: Forex, Live Trading Records
05 July 2012
Main Forex Pairs 5-Minutes Charts


Main Forex Pairs Hourly Charts


Main Forex Pairs Daily Charts


Main Forex Pairs Weekly Charts


11 July 2011
Marsa on Forex (2)
It's so easy...no?
If you were to look at forex trading from alternate point of view, it is actually very easy. All you have to do is to buy low and sell high, or sell high and buy low. That's how you make money. And anyone can do it. There are so many systems and methods out there that can do this for you. If you were to backtest any technical method, you would find that it would make you money whether you like it or not. Let's take the RSI for example. It's an oscillator that measures overbought and oversold conditions and generates reliable signals. You can even plot support and resistance levels and trendlines on the RSI. You can also trade convergences and divergences at tops and bottoms. For example, trading the divergence on the EURUSD 1-hr would have you short at 1.4224 with a 35-pip stop loss at 0000hrs 5 November, you'd be 200 pips richer today.
Back-Testing
There are lots of other methods and systems that actually work and can make you money. You only have to backtest them enough times to select one that you are comfortable with and that it suits your trading lifestyle. In backtesting these, you must work out their effectiveness against the different timeframes. Don't just plot an indicator or oscillator and scroll the charts back and forth and look for the "what ifs". What you should do is to apply your method or system and write down the points of entry and the subsequent profits or losses. Do this on different pairs. Then after a lengthy compilation of say, 100 trades, tabulate them into profits and losses and work out the averages. For example, when you apply your method to the 15-min charts, what is your average loss and profits. Try it on other timeframes. From here, work out if the method is profitable or not. If your method produces a 70% win it should be a good one. With a risk to reward ratio of 1:1, you should be making money. At the back of your mind, do know that no system or method is perfect no matter where it comes from. What we do is to make use of them to take calculated risks to generate profits and minimise losses.
Bad Losing Habits
Now, the only thing that can stop you from making money or make you lose money is yourself. Yes, you yourself, no one else, not your computer, not your charts, not your broker but you yourself. Why people lose money is because of their vested emotions with each trade. They can't help it. They tend to interfere with their positions and forget all the backtesting that they have done. For example, when their stop loss is at 35 pips and prices are approaching it, they either shift it or remove it altogether and take on potentially larger losses. Similarly, before prices move to their take-profit of 35 pips, they close their position prematurely and make less than intended. When they do this, they are back to the losers' old bad habit of consistently losing money. They have lost control. Then they think that the system or method doesn't work and go hunting for another system. What a waste of time and effort! And money!!
Hope and Fear
Such losing traders tend to resort to hope and fear. When they are losing, they hope that prices would move to breakeven or better. When prices are in the profit zone, they fear that the profit would shrink if they don't close their positions fast. The end results are larger losses and smaller profits.
Let's compare this to the winning traders. When they are losing, they fear larger losses and react by closing out the losers. When prices are on the plus side, they sit idly by and hope for bigger profits. The end results are smaller losses and larger profits.
Challenge yourself
So how do you, if you are a struggling trader, turn yourself around? You can only do so with a change of mindset. Of course it is easier said than done but one good way to overcome this is to put in your trade and turn off the computer. Simple as that. Know that the outcome has already been defined by you and taken care of. You are confident that you are either going to win or lose and you know how much too. You do not have to trade many times a day. Just one trade per day will do. Get out of your house and go as far as you can from your computer. And resist checking prices on your mobile. Check back much later to view your results. Win or lose, now, that is a good trade! Keep doing this until it becomes a habit. With your backtested method, you can't lose. 10 trades over 10 days, you are going to win 7! Congratulations! You are going to be a winner. Period.
Complicating yourself
Don't complicate your trading life. Forget about those monthly, yearly or decade charts. You won't know what to make of them anyway. Even if the monthly chart tells you that the trend is down, the weekly, daily, 4-hourly or hourly charts can swing 500 pips or more up within the month before coming off. So don't try to be too smart and look at too many different angles. You will only be confused. And keep your charts simple. If you are trading your own method or system, for example, the RSI, don't throw in the other obstacles like Bollinger Bands, Momentum, multiple moving averages, Stochastics, MACD, etc. Just use your RSI and just trade off it. After all, you've found your niche. So don't spoil it.
Trading Platforms
I can't think of or find another better trading platform for the beginner or even those who are still struggling other than Oanda's fxTrade with it's low spreads and odd-lots trade sizes. If you are the type who doesn't believe the recommendations of the many Oanda users here, you can try elsewhere but do know that if you go looking for trouble, you will surely find it. Don't go looking for something to whine about later. And for those who think they can trade on news, LOL! they can check out FXNews by clicking on the Resources tab.
Margins, Nuts and Bolts
For those who are still unsure about margins, leverage, customizing charts, etc, check out the following:
http://www.oanda.sg/assistance/quickguides/trading-getting-started/account-summary
For those who are still re-loading the indicators everytime they log in on Oanda's fxTrade, there is a feature to save your preferences and it can be found under the Tools tab.
tanchoo1, what an excellent contribution! I would tend to believe that you are a professional trader. You seem to be doing well. Keep it up and do keep your articles coming!
To those who are new and those who are still struggling, do read these guidlines by tanchoo1. After you have finished reading them, read again and build your own plans around them. They should help you a great deal.
MetaTrader4
About the MetaTrader4 platform, I was using it only because I was used to it. Now I am weaned off it and am used to trade off Oanda's fxTrade platform. For those who are keen on MT4, let's wait and see if Oanda releases it before year-end.
Labels: Forex
10 July 2011
Marsa on Forex (1)
1. Start off with a positive mindset, a winning one. Sounds easy yet ambiguous. Here are some starting pointers:
a. Be objective. Accept what you see on the charts. If prices are moving up, just accpet that they are moving up and vice versa. Don't fight them as you are nobody in this 4-trillion-dollar behemoth.
b. Treat losses as part of business costs. Trade forex as if you are running a business and know that all businesses do incur losses.
c. Do not gamble. Gambling is always negative and is bad for your trading psyche. If you make profits from gambling, you will allow yourself to do it over and over again. It will become a habit. As is well known, a habitual gambler will eventually go bust and that's not the results that you want.
d. Throw your ego out the window. One of the greatest downfall of many traders is their big fat ego. You see them everywhere shouting out loud to get attention, belittling others and always trying to prove they are right through their calls. If you have such tendencies, get a hold on yourself and stop it. Or else, do yourself a favour and stop reading further.
2. Learn or polish up on technical analysis. There is no other way.
a. Select a timeframe that you are comfortable with. Then select some technical elements like chart patterns, support and resistance levels, indicators, oscillators, etc and back-test them. Throw out what you find useless or don't understand. Take your time and do take notes as in writing down on a pad or book. Do screen captures and print them. Narrow your selections down to a bare minimum. The selections must satisfy you as the most profitable criteria. Using these filtered down selections, find out where your entry and exit points are. This defines your trading plan.
b. Do not clutter up your charts with too many indicators and what-nots. They will only confuse you. If you look at the charts I posted, there are only 2 oscillating lines and a useless MACD (which I use just to decorate my charts to make them look nicer) at the bottom.
c. Print out the charts with your criteria on hard copies or save them in your mobile. Review them when you are away from your computer, like having a tea break, travelling in a bus or the train, sitting on the toilet bowl, before going to bed. In other words, eat, breathe and sleep them!
3. Avoid forming opinions based on external sources. They will make you confused.
a. Do not read news or reports about currencies. You do not know what to make of them. For illustration purposes, those who went long the USDJPY on BOJ intervention mid-September are now some 450 pips poorer if they had hung on to the news.
b. Do not read or follow other traders's calls. Remember that 95% of them are always wrong and the other 5% (the winners)won't tell you anything. After all, this 5% make their profits from the other 95%!
c. Just rely on the charts.
4. Open a live account.
a. Don't waste time with a demo account. The reason why demo trading is useless is it is devoid of emotions and as far as trading is concerned, it is all about emotions. I would attribute trading to 90% emotions and 10% technical. Trading a live account lets you truly feel the market where real money is at stake.
b. Fund your account with money that you can spare, not the money that you need to pay your bills, housing loans, car loans, children's education or your food.
c. Open your account with Oanda which offers odd lots. Remember, you need not go into forex trading in a big grand manner and trade a 100,000 units per clip. With Oanda, you can trade just 10, 40, 50, 100 or anything between 1 and 10 million units. For beginners, I would strongly suggest that you trade a minimum of 100 to a maximum of 5,000 units which is about S$0.013 (one cent) to S$0.65 (fifty cents) per pip respectively for USD-denominated pairs. You can trade bigger units when you have built up your confidence.
5. Trading.
a. I would recommend the less volatile pairs like EURUSD or the USDJPY both of which enjoy the highest liquidity in the forex markets.
b. Now that you are armed with your trading plan vide 2a. above, put it in the moment you have detected and recognised your setup on the charts. Your plan consists of your entry, your stop loss and your take profit points.
c. After you have put in your plan, just sit down and do nothing if you are watching the prices. Do be aware of your emotions which will tempt you to alter your plan. Alternatively, leave your screen and shut your computer down. Remember, whatever it is, please stick to your plan. Don't micro-manage it or alter it.
d. Check on your performance later. Whether the outcome is positive or negative, you should adopt a neutral stance. Forget it if you made a loss. Do not think that you are no good or worse, blame everything and everyone except yourself. Forget it even more if you made a profit. Do not think that you are very smart; the markets can give you more money than you ask for. Your job here is to find out why you won or lost. Back-track and note down why. After having digested the reasons for your results, you will know what to do and what not to do in your next trade.
6. Conclusion. If you can fulfil all of the above, you must keep at it, especially respecting your plans. If you break the guidelines and lose, then close your account and recognise that forex trading is not for you.
Labels: Forex
![]()