09 April 2012
NOL CFD Short Position Covered at 1.41 With a Loss
Chart turning bullish, SMA50/100/200 formed nice gold crossings, bull run likely to have started.


Labels: CFD, Live Trading Records


05 April 2012
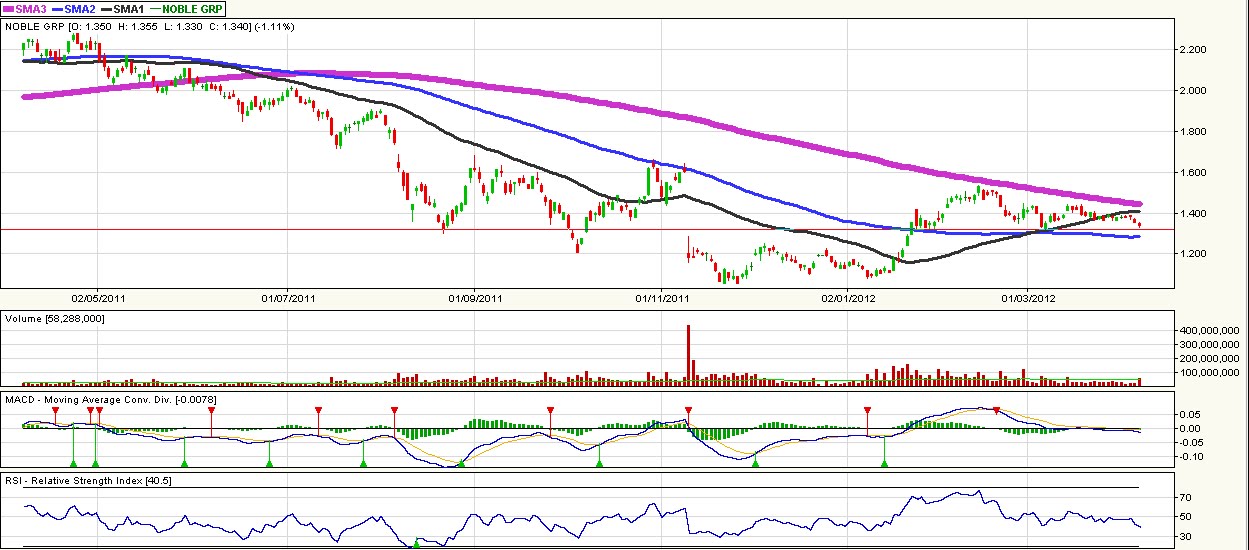
Cosco and Noble CFD Short Positions Closed With Profit
Cosco closed at 1.13, today's low of 1.12 at previous low @1.12.
Noble closed at 1.335, today's low of 1.33 near previous low @1.32.


Noble closed at 1.335, today's low of 1.33 near previous low @1.32.

Labels: CFD, Live Trading Records
27 March 2012
Ezion CFD(DMA)
short position stopped out at 0.98
Correction
not stopped out due to having bought CFD at .98 instead of CFD(DMA) because CFD(DMA) was shorted in the first place rather than CFD.
As a result, I have two different positions now!
CFD(DMA) short position 16 lots
CFD long position 16 lots
What a hell with Phillip CFD and CFD(DMA)!!!
must be very very carefeul next time.
Current status as of 03 Apr 2012
CFD(DMA) short position 16 lots (bought back at .98 on 02 Apr 2012)
CFD long position 16 lots (still in hand) - stopped out at .97 on 17 Apr 2012
Labels: CFD, Live Trading Records
08 March 2012
Ezion shorted at 0.90

29 February 2012
COSCO shorted at 1.21 Using CFD
Reasoning
Weekly chart bearish engulfing;
I've been holding this stock and not been intending to sell yet but knowing that price may correct potentially. If price rises, I have stocks and will not lose money overall; if down, CFD makes money and I can take profit when bullish signal appears while stocks still in hand.
Should have adopted this strategy ealier...

Labels: CFD, Live Trading Records
28 February 2012
Noble shorted at 1.395 Using CFD
Reasoning
Weekly chart bearish engulfing / evening star;
I've been holding this stock and not been intending to sell yet but knowing that price may correct potentially. If price rises, I have stocks and will not lose money overall; if down, CFD makes money and I can take profit when bullish signal appears while stocks still in hand.
Should have adopted this strategy ealier...

Labels: CFD, Live Trading Records
27 February 2012
NOL shorted at 1.34 Using CFD
Reasoning
Weekly chart bearish engulfing;
I've been holding stocks and not been intending to sell yet but knowing that price may correct potentially. If price rises, I have stocks and will not lose money overall; if down, CFD makes money and I can take profit when bullish signal appears while stocks still in hand.

Labels: CFD, Live Trading Records
20 October 2011
My Financial Plan
(Updated on 26 Aug 2013)
1.0 Assets
1.1 Bank Savings
Time depositsSavings accounts
1.2 Mini Cash Fund for Children
Monthly Transfer (to convert to Nikko STI ETF 100 when it drops by 50% or more from historical high, best for kids - 26 Aug 2013)1.3 Salary Income
1.4 Property
2.0 Insurance
NTUC I-Term Life Insurance (Self, wife)
Company Group Term Life Insurance Underwritten by HSBC (Self)
Company Group Critical Illness Insurance Underwritten by HSBC (Rider to Company Group Term Life Insurance)(Self)
Company Group Personal Accident Insurance Underwritten by AXA(Self)
CPF Medishield Life (Self, wife, children)
Company Group Hospital and Surgical Insurance Underwritten by Tokio Marine Life(Self)
Company Group Outpatient Insurance for GP / Specialist Underwritten by Tokio Marine Life(Self)
Company Group Business Travel Insurance Underwritten by AXA(Self)
CPF Home Protection Scheme (HPS) (Self, wife)
CPF Dependants' Protection Schedme (DPS) (Wife)
Home Fire Insurance Underwritten by AIA (changed to ETIQA Insurance Berhad, 1 North Bridge Road #08-01 High Street Centre Singapore 179094 from 20 Apr 2012, Tel 6331 9253, 6331 9254) (Self, wife)
3.0 Debt & Expenditures
Property Mortgage
Family Food
Water & Power Bills
Community Town Council Charges
Telephone & Broadband
Tuition
Fund for Parents
School Fees
Painting Course for Children
Piano Course for Children
School Meals
Travel & Entertainment
Shareinvestor Subscription
Poems ProTrader Subscription
4.0 Investment Plan
4.1 Long Term Investment Plan
4.1.1 CPF
CPF Ordinary Account (to convert investable portion to Nikko STI ETF 100 when it drops by 50% or more from historical high - 26 Aug 2013)
CPF Special Account (to convert investable portion to Nikko STI ETF 100 when it drops by 50% or more from historical high - 26 Aug 2013)
CPF MediSave
4.1.2 A Small Pension Fund with Mercer in Australia
to convert to EWA or stock index ETF traded in Australia stock market when the ETF drops by 50% or more from historical high - 26 Aug 20134.1.3 Monthly Dollar Cost Averaging (DCA) on STI ETF 1000 (Committed, ongoing, with Phillip Securities Pte Ltd)
Buy S$5,000 worth of STI ETF units through Phillip Share Builders Plan(SBP) by Phillip Securities on 18th day of every month irrespective of price. Started in May 2011 and ongoing, investment period - 30 years or more
Objective - To achieve 7 to 8% compounded annual growth rate (CAGR) consistently
Note - units bought can be transferred to margin account, if necessary, to increase purchasing power up to 3 times of net assets.
(To expand with supporting documents)
4.1.4 Long Term Stock Index ETF Investment (With Standard Chartered Bank Singapore)
STI ETF 1000 (with SCB, to continue to buy whenever the market looks bleak or pessimistic)
Nikko AM STI ETF 100 (with SCB, to continue to buy whenever the market looks bleak or pessimistic) (Nikko AM STI ETF 100 is the former DBS STI ETF 100. DBS Asset Management was acquired by Nikko Asset Management. Nikko AM is majority-owned by The Sumitomo Trust and Banking Co., Ltd., while DBS Bank Ltd is the second largest shareholder, controlling 7% plus. Employees also own a stake in the company.)
4.1.5 Dollar Cost Averaging (DCA) At Price Correction Levels of 50, 60, 70, 80, 90, 95% From Historic High (Plan, to implement)
Use margin account (why? - shares bought can be used as collateral for further DCA and short term trading as mentioned below in case cash is depleted during DCA at various correction levels).
Five excellent opportunities were created for long term investors like Warren Buffet to accumulate blue chip index funds (if available) and blue chips from the past 7 serious corrections in Singapore stock market in the past 32 years (I only have so many data) that we could take advantage of by using the method mentioned above.
STI achieved more than 100% profit each time in 4 out of these 5 excellent opportunities after corrections; While STI achieved 91% profit so far after the latest correction due to US financial crisis in 2008. STI achieved a profit as high as 181% (formula: (High after serious correction - DCA Price) / DCA Price = 181%) after a serious correction from high in Jan 1984,
114% after a serious correction from high in Aug 1987,
132% after a serious correction (caused by Asian financial crisis triggered by currency attacks by George Soros, a Hungarian-American Jewish financial speculator) from high in Feb 1996,
203% after a serious correction (caused by bursting of US Internet bubble in 2000 and 911 terrorist attack to World Trade Center in New York by Osama Bin Laden of Al-Qaeda on 11 Sep 2001) from high achieved in Jan 2000,
91% so far after a serious correction (caused by US Sub prime mortgage crisis and collapse of Lehman Brothers) from high achieved in Oct 2007.
In total, STI achieved a CAGR of 11.44% (formula: (2^5)^(1/32)-1 = 11.44%) assuming that we had bought STI 5 times and had achieved 100% profit on average each time in the past 32 years.
In fact, some profit could also be achieved from remaining 2 out of 7 opportunities created by serious corrections in the past 32 years. Although STI failed to drop 50% or more during these 2 corrections, but some large / mid caps could fall 50% or more and thus buying opportunities could still be created.
Some dividend could also be collected in the past 32 years.
Therefore, STI could achieve a better CAGR than 11.44% as projected above, which would be much higher than 7 to 8% compounded annual growth rate (CAGR) that was supposed to produce by means of "Monthly Fixed Amount Dollar Cost Averaging (DCA) on STI ETF".
Guess what will happen if we have another 5 times of serious corrections in the coming 30 years?
Just buy and hold until DCA prices double, our money will become 25.77 times of current amount ((formula: (1+11.44%)^30 = 25.77)! In other words, we will have 25.77 million dollars in 30 years if we have an investment fund of 1 million dollars now!
Targeted market - SGX
Targeted counters - STI ETF, Nikko AM STI ETF, majority of large caps (STI 30 components) and some selected mid caps
Targeted market - US Markets
Targeted counters - Large (>US$5b) and solid (fund buys index components only and diversified with many counters preferably more than 100) ETF's such as SPY MDY QQQ DIA EEM IWM EFA EWZ XLE XLF FXI GDX VWO IVV XLU XLK IWF VTI IWB IWD IJR IVW VGK IWR IJH VEU VEA VOO GLD SLV. Buy levels (retracing 50, 60, 70, 80, 90% from 2007 high) and placed alerts at 50% in the IB trading platform already on 04 Jun 2012.
Investment period - 1 to 3 years
TP - Doubling of DCA price or higher
(To expand with supporting documents)
4.1.6 Buy quality condominium during economic recessions / crises when price drops by 50% or more if fund is available then
Investment period - 1 to 3 years
TP - doubling of purchase price or higher
4.2 Short Term Trading Plan
4.2.1 Trade long using margin A/C
Trading conditions
Trend is up (SMA50 > SMA100 > SMA200 and all must point upwards) and price breaks out of double bottom formation
Targeted Market
SGX, HK, US, KL(if chart is available), UK (if available for trading)
Targeted counters
Large caps and selected SG mid caps
Trading platform
Poems / Poems ProTrader / IB
Order type
Limit / stop / stop limit
SL
Stop loss, to place stop limit order daily if possible
TP
To be determined by trailing stop if possible
Note: A few stocks, COSCO Sinagpore, NOL, Noble Group, Nam Cheong, bought a few years ago are still in the margin trading account with Philip Securities Pte Ltd icluding. Nam Cheong is in paper profit. I believe the other three will recover their paper losses sooner or later in the future. In addition, there is about S$24k invested in the Phillip Securities Managed Cash Fund (MMF).
4.2.2 Trade short using CFD A/C
Trading conditions
Trend is down (SMA50 < SMA100 < SMA200 and all must point downwards) and price breaks out of double top formation
Targeted Market
SGX, HK, US, KL(if chart is available), UK (if available for trading)
Targeted counters
Large caps and selected SG mid caps
Trading platform
Poems CFDTrader / IB
Order type
Limit / stop / stop limit
SL
Stop loss, to place stop limit order daily
TP
To be determined by trailing stop
5.0 FAQ
Why buy CPF Medishield instead of Private Medishield or private health plan?
Former NTUC Income chief TKL explained excellently, to attach what he said.
Why trade HK, US, UK (if possible) and KL markets also?
To have sufficient number of large caps so that more potential opportunities can be identified since the trading conditions set above are very stringent and thus opportunities are rare if no at all. Trading setup with stringent conditions produces high probability rate of success (as high as 80%) (to expand with supporting document).
I met this problem and made no money from 2009 low so far despite I have an excellent trading system because I focus on Singapore market only but opportunities here are rare. When I looked at other markets such as HK and US, there were many opportunities that had met the stringent conditions mentioned above!
Why not trade Forex any more?
Real trading with Poems (lost about S$10,000) and Demo trading with Oanda (Lost about US$12,500 of fake money given by Oanda) in the past few months indicate that forex was not or will not be a cup of tea for me. US$12,500 in total was lost even though my risk per trade is S$100 to 300 only for demo trading!
On the other hand, equities are more stable and more predictable.
I am more comfortable with equities because I know many good opportunities will still be out there in the future.
(Update to be continued...)
6.0 Reference
S&P 500 Price (Inflation Adjusted)
S&P 500 PE Ratio
Risk management
The 3 Secrets of Margin Trading - Position Sizing, Risk Management and How to Track Total Exposure
Position Sizing
Position Sizing: How to Limit Risk & Maximize Gains
STI ETF
4 Reasons to invest in STI ETF
Why and How to do long term investment in STI ETF using Dollar Cost Averaging Method?
Nikko AM STI ETF, Investment Plan
Buy STI ETF Using Dollar Cost Average Method
Trading System
The most profitable and safest trading system in a bull market
New dummy trading system
Reflection on Trend - 08 Nov 07, Thu
TA Essence in my trading system
Historical Teaching
疯狂的代价:世界上最惨烈的几次股市大崩盘
Labels: CFD, Dollar Cost Averaging, ETF, Health, Margin, plan, Position Sizing, Risk Management, STI ETF, Stock Trading System, Thoughts
13 October 2011
The 3 Secrets of Margin Trading
By Teeka Tiwari - Creator: ETF Master Trader
A question I get asked often is, "should I use margin?"
For those of you that are new investors, margin is a tool used to leverage or "gear up" the buying power in your brokerage account. The way it works is that for every dollar in value you have in your account, your brokerage firm will lend you an additional dollar. So $10,000 in cash will buy you $20,000 worth of stocks.
Margin can be a very powerful wealth accumulation tool when you are right on your stock market calls, but it can be a wealth killer when you are wrong!
Like most things in life, if you’re an adult about it, there are ways to use margin very successfully without blowing off your fingers.
There are three keys to successful margin use...
Position Sizing
This is where a lot of people get in trouble. They hold positions that are way out of whack with the size of their account.
Here is the key with position sizing: Risk no more than 1% to 2% of your account value per trade. In my training program, ETF Master Trader, we call each of these 1%-2% investments a "unit of risk."
So does that mean if you have a $10,000 account, and use margin to bring that up to $20,000, that you only put $400 (2% of $20,00) into each trade????
NO!
Use a Stop Loss
This brings me to the second key to successful margin use.
When I talk about only risking 1%-2% of your account value, I am referring to the difference between where you buy a stock, and where you place your stop loss.
Here is an example...
A stock is trading at $20, and you have determined that your stop loss level is at $18.
So the risk per share is $2, and you have a $10,000 account. 2% of $10,000 equals $200. That means that if you are risking 2% of your account value, then you can buy 100 shares. This way if you get stopped out you only lose 2% of your account value (100 shares x $2 loss = $200).
Notice that I did not use your margin value of $20,000 to calculate the 2%. Instead I used the more conservative approach of your actual cash value of $10,000.
The advantage of margin isn't so that you can take bigger positions, because your position size will always be dictated by the amount that you are willing to lose (1%-2% of your account value).
The advantage of margin is that it will allow you to put on more positions.
Track Total Exposure
This is the most important part of margin trading, and something that very few investors are even aware of. Even if you use a stop loss and proper position sizing you can still lose money if you have too much market exposure at one time.
Let me explain...
If you have 15 open positions, all risking 2% of your account value, and the market gets slammed you could be looking at 30% in account losses. That is way too much risk to have on at any one time.
What I suggest to my ETF Master Trader subscribers is that they have no more than 6 units of open risk at any one time. Remember, a unit of risk is an open trade where we have risked 1%-2% of our account value. So if 6 trades go against you, you're looking at 6%-12% in losses, which is far more manageable.
Now this is the fun part -- if I've done my homework right and my stocks are going up, well then I will also be raising my stop as the stock goes higher. Remember: Our first stop is put on to save our money, and the second stop is put on to save our profit!
Here is the secret to making big money using margin...
As soon as my profit protecting stop either rises to or above my entry price, then lo and behold I have freed up another unit of risk to use in my trading. And that is where having access to margin can really allow me to cook when things are going my way.
This is because I am only adding more positions to my account as I move deeper and deeper into profits. But all the while, I am never risking more than 6%-12% of my original investment.
This is so powerful, because it keeps me from adding more units of risk when I am losing money, and has me adding many more positions when I am making money.
So, if I own a stock at $20, with an $18 stop and the stock goes to $25 and I adjust my profit protecting stop to $23, guess what? That unit is now in profits, and I have freed up another unit that I can add to my portfolio.
Remember: The most important thing to do is to always track your open units of risk. An open unit of risk is a position that you hold where its stop loss price has failed to reach or exceed your entry price. Never let your open units of risk rise above 6, never go bigger than 1%-2% of your account value per unit, and you will be well on your way to mastering margin and reaching your financial goals far faster and with far less risk than you ever imagined.
Labels: CFD, Margin, Position Sizing, Risk Management, Stock Trading System, Thoughts

